Farm, Crop and Livestock In<strong>for</strong>mation by County, 2000 Total Land Total Total Value Number in Farms Acres of District/County of Farms (acres) Harvested Field Crops -1 Total Value of Livestock and Poultry Produced - 2 Southeast District: Allen 650 280,000 148,300 $15,835,700 $10,304,606 Bourbon 810 338,000 107,430 11,495,500 17,001,805 Butler 1,270 765,000 246,610 28,981,800 56,867,610 Chautauqua 370 389,000 28,500 2,647,400 17,034,703 Cherokee 780 275,000 198,930 21,057,000 6,228,806 Cowley 970 634,000 208,810 23,168,900 31,586,206 Craw<strong>for</strong>d 790 301,000 165,480 18,547,000 13,389,603 Elk 380 328,000 43,400 5,020,100 12,356,707 Greenwood 590 613,000 83,350 8,746,900 33,761,305 Labette 920 344,000 158,620 18,176,500 22,856,006 Montgomery 950 326,000 121,300 13,342,500 13,516,706 Neosho 720 332,000 145,710 14,521,300 15,352,303 Wilson 540 311,000 163,050 17,070,600 10,176,403 Woodson 360 264,000 99,310 10,928,900 11,191,301 District Total: 10,100 5,500,000 1,918,800 209,540,100 271,624,070 State Total 64,000 47,500,000 21,639,000 2,915,660,000 $2,901,469,000 1-Does not include any Government Program Payments. 2-Includes meat animals, chickens, eggs, wool, and milk. Source: <strong>Kansas</strong> Agricultural Statistics, <strong>Kansas</strong> Farm Facts, <strong>2001</strong>. <strong>Kansas</strong> Agricultural Exports, 1996-2000 (Million Dollars) Commodity 1996r 1997r 1998r 1999r 2000 Wheat and Flour 851.4 506.3 699.1 805.5 721.5 Total Feed Grains 628.8 605.1 486.1 533.1 528.2 Live Animals and Meat 782.9 678.7 709.7 765.5 969.7 (Excluding Poultry) Hides and Skins 289.3 282.7 228.7 200.2 286.7 Soybeans & Products 186.3 287.7 291.7 178.9 203.9 Feeds & Fodders 181.0 185.5 191.7 185.9 212.7 Fats, Oils, & Greases 124.0 92.1 120.5 106.1 92.1 Seeds 21.6 38.7 27.3 26.0 29.9 Sunflowers and Oils 20.1 24.3 20.9 16.9 23.0 Dairy Products 3.3 3.9 3.5 2.6 0.8 Other 2.7 2.7 2.6 2.5 2.5 Total 3,091.4 2,707.6 2,781.9 2,823.3 3,030.1 r = revised. Source: <strong>Kansas</strong> Agricultural Statistics, <strong>Kansas</strong> Farm Facts, <strong>2001</strong>. www.nass.usda.gov/ks/ffacts/<strong>2001</strong>/
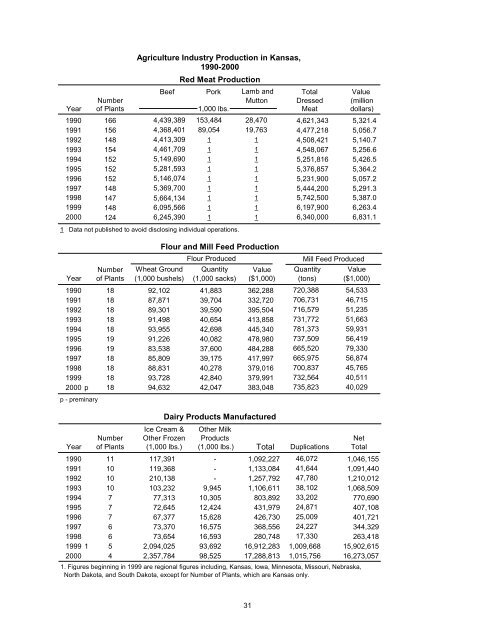
Agriculture Industry Production in <strong>Kansas</strong>, 1990-2000 Red Meat Production Beef Pork Lamb and Total Value Number Mutton Dressed (million Year of Plants 1,000 lbs. Meat dollars) 1990 166 4,439,389 153,484 28,470 4,621,343 5,321.4 1991 156 4,368,401 89,054 19,763 4,477,218 5,056.7 1992 148 4,413,309 1 1 4,508,421 5,140.7 1993 154 4,461,709 1 1 4,548,067 5,256.6 1994 152 5,149,690 1 1 5,251,816 5,426.5 1995 152 5,281,593 1 1 5,376,857 5,364.2 1996 152 5,146,074 1 1 5,231,900 5,057.2 1997 148 5,369,700 1 1 5,444,200 5,291.3 1998 147 5,664,134 1 1 5,742,500 5,387.0 1999 148 6,095,566 1 1 6,197,900 6,263.4 2000 124 6,245,390 1 1 6,340,000 6,831.1 1 Data not published to avoid disclosing individual operations. Flour and Mill Feed Production Flour Produced Number Wheat Ground Quantity Value Year of Plants (1,000 bushels) (1,000 sacks) ($1,000) 1990 18 92,102 41,883 362,288 1991 18 87,871 39,704 332,720 1992 18 89,301 39,590 395,504 1993 18 91,498 40,654 413,858 1994 18 93,955 42,698 445,340 1995 19 91,226 40,082 478,980 1996 19 83,538 37,600 484,288 1997 18 85,809 39,175 417,997 1998 18 88,831 40,278 379,016 1999 18 93,728 42,840 379,991 2000 p 18 94,632 42,047 383,048 p - preminary Mill Feed Produced Quantity Value (tons) ($1,000) 720,388 54,533 706,731 46,715 716,579 51,235 731,772 51,663 781,373 59,931 737,509 56,419 665,520 79,330 665,975 56,874 700,837 45,765 732,564 40,511 735,823 40,029 Dairy Products Manufactured Ice Cream & Other Milk Number Other Frozen Products Net Year of Plants (1,000 lbs.) (1,000 lbs.) Total Duplications Total 1990 11 117,391 - 1,092,227 46,072 1,046,155 1991 10 119,368 - 1,133,084 41,644 1,091,440 1992 10 210,138 - 1,257,792 47,780 1,210,012 1993 10 103,232 9,945 1,106,611 38,102 1,068,509 1994 7 77,313 10,305 803,892 33,202 770,690 1995 7 72,645 12,424 431,979 24,871 407,108 1996 7 67,377 15,628 426,730 25,009 401,721 1997 6 73,370 16,575 368,556 24,227 344,329 1998 6 73,654 16,593 280,748 17,330 263,418 1999 1\ 5 2,094,025 93,692 16,912,283 1,009,668 15,902,615 2000 4 2,357,784 98,525 17,288,813 1,015,756 16,273,057 1. Figures beginning in 1999 are regional figures including, <strong>Kansas</strong>, Iowa, Minnesota, Missouri, Nebraska, North Dakota, and South Dakota, except <strong>for</strong> Number of Plants, which are <strong>Kansas</strong> only.
- Page 1 and 2: Kansas Statistical Abstract 2001 36
- Page 3 and 4: Table of Contents Foreword ........
- Page 5 and 6: Education (con’t) Percent High Sc
- Page 7 and 8: Housing and Construction (con’t)
- Page 9 and 10: Transportation (con’t) Expenditur
- Page 11 and 12: Preface Special thanks are owed to
- Page 13 and 14: County Rankings December 2002 Kansa
- Page 15 and 16: Selected County Population Rankings
- Page 17 and 18: Selected County Rankings Per Capita
- Page 19 and 20: Selected County Rankings Per Capita
- Page 21 and 22: State Summary, 2000 Acres Acres Yie
- Page 24 and 25: Thousands 100 NumberofFarmsinKansas
- Page 26 and 27: Land Area and Proportion in Farms 1
- Page 28 and 29: Farm, Crop and Livestock Informatio
- Page 32 and 33: Agriculture Industry Production In
- Page 34 and 35: Farm Value of Kansas Livestock and
- Page 36 and 37: Livestock Shipped Into Kansas, by S
- Page 38 and 39: ThousandsofDollars 35 30 25 20 Aver
- Page 40 and 41: Crops Percentage of Farm Cash Recei
- Page 42 and 43: Total Loans/Total Assets and Net Fa
- Page 44 and 45: Banking and Finance December 2002 K
- Page 46 and 47: Bank Deposits in Kansas by County F
- Page 48 and 49: Banking Growth in Kansas 1949-2001
- Page 50 and 51: New Firms by State, 1995-2000 Perce
- Page 52 and 53: Self-Employment by State, 1995-2000
- Page 54 and 55: Hispanic-Owned Businesses in Kansas
- Page 56 and 57: Women-Owned Businesses in Kansas, 1
- Page 58 and 59: Manufacturing in Kansas 1998r All e
- Page 60 and 61: Manufacturing in Kansas 2000 All em
- Page 62 and 63: Kind of Business Retail Trade in Ka
- Page 64 and 65: Wholesale Trade in Kansas, 1997 Typ
- Page 66 and 67: Total Annual Payroll ($1,000) by In
- Page 68 and 69: Total Annual Payroll ($1,000) by In
- Page 70 and 71: Total Annual Payroll ($1,000) by In
- Page 72 and 73: Total Annual Payroll ($1,000) by In
- Page 74 and 75: Total Annual Payroll ($1,000) by In
- Page 76 and 77: Total Annual Payroll ($1,000) by In
- Page 78 and 79: Number of Establishments by Industr
- Page 80 and 81:
Number of Establishments by Industr
- Page 82 and 83:
Number of Establishments by Industr
- Page 84 and 85:
Number of Establishments by Industr
- Page 86 and 87:
Number of Establishments by Industr
- Page 88 and 89:
Number of Establishments by Industr
- Page 90 and 91:
Taxable Retail Sales, by County 199
- Page 92 and 93:
Taxable Retail Sales, by County 199
- Page 94 and 95:
Taxable Retail Sales, by County 199
- Page 96 and 97:
Taxable Retail Sales, by County 199
- Page 98 and 99:
Taxable Retail Sales, by County 199
- Page 100 and 101:
County Trade Pull Factors* FY 1990-
- Page 102 and 103:
Value Value Value Rank Country 1999
- Page 104 and 105:
Kansas Gross State Product by Indus
- Page 106 and 107:
Patent Grants by County, 1990-1999
- Page 108 and 109:
KansasRegionalTemperatures,2000 Jan
- Page 110 and 111:
Precipitation in Kansas, 2000 and A
- Page 112 and 113:
Kansas County Precipitation 1997-20
- Page 114 and 115:
Communications December 2002 Kansas
- Page 116 and 117:
Daily Newspapers of Kansas, 1993-20
- Page 118 and 119:
Daily Newspapers of Kansas, 1993-20
- Page 120 and 121:
Total Crime Index Offenses in Kansa
- Page 122 and 123:
Crime Index Offenses by County* 199
- Page 124 and 125:
Arrests by County 1995-1998 County
- Page 126 and 127:
Admissions and Releases All Institu
- Page 128 and 129:
Inmate Characteristics in Correctio
- Page 130 and 131:
Number of Full-Time Law Enforcement
- Page 132 and 133:
Allen Anderson Atchison Barber Bart
- Page 134 and 135:
Number of Accredited Public Schools
- Page 136 and 137:
High School Graduates by County, by
- Page 138 and 139:
Percent High School Graduate or Hig
- Page 140 and 141:
County Headcount Grades 7-12 High S
- Page 142 and 143:
Pupil-Teacher Ratio by County, 2001
- Page 144 and 145:
Kansas School Districts: 2001 Schoo
- Page 146 and 147:
Kansas School Districts: 2001 Schoo
- Page 148 and 149:
Kansas School Districts: 2001 Schoo
- Page 150 and 151:
Current Expenditure Per Pupil in Pu
- Page 152 and 153:
Kansas School Districts: Estimates
- Page 154 and 155:
Kansas School Districts: Estimates
- Page 156 and 157:
Kansas School Districts: Estimates
- Page 158 and 159:
Kansas School Districts: Estimates
- Page 160 and 161:
Enrollment in Kansas' Four-Year Col
- Page 162 and 163:
Enrollment in Kansas' Four-Year Col
- Page 164 and 165:
Enrollment in Kansas' Technical Col
- Page 166 and 167:
County Less than 9th Grade 9-12th G
- Page 168 and 169:
Public Library Materials by State,
- Page 170 and 171:
Public Library Service by State, FY
- Page 172 and 173:
Public Library Service by State, FY
- Page 174 and 175:
Public Libraries Providing Access t
- Page 176 and 177:
Elections December 2002 Kansas Stat
- Page 178 and 179:
Allen Anderson Atchison Barber Bart
- Page 180 and 181:
Kansas General Election Statistics
- Page 182 and 183:
County Kansas General Election Stat
- Page 184 and 185:
Kansas General Election Statistics
- Page 186 and 187:
County Kansas General Election Stat
- Page 188 and 189:
Kansas General Election Statistics
- Page 190 and 191:
Kansas General Election Statistics
- Page 192 and 193:
Voter Registration and Party Affili
- Page 194 and 195:
Civilian Labor Force in Kansas 1950
- Page 196 and 197:
Civilian Labor Force Estimates by C
- Page 198 and 199:
Civilian Labor Force Estimates by C
- Page 200 and 201:
MillionsofPersons 1.44 1.42 1.40 1.
- Page 202 and 203:
Unemployment Rates in Kansas by Cou
- Page 204 and 205:
ThousandsofPersons 70 KansasUnemplo
- Page 206 and 207:
Kansas Labor Market Summary 2000 an
- Page 208 and 209:
Employment Data for Metropolitan St
- Page 210 and 211:
Mid-March Employment by Industry, 1
- Page 212 and 213:
Mid-March Employment by Industry, 1
- Page 214 and 215:
Mid-March Employment by Industry, 1
- Page 216 and 217:
Mid-March Employment by Industry, 2
- Page 218 and 219:
County Real Estate Prof. Sci.& Admi
- Page 220 and 221:
Mid-March Employment by Industry, 2
- Page 222 and 223:
Farm and Nonfarm Employees* by Coun
- Page 224 and 225:
State Average Annual Pay for 1999 a
- Page 226 and 227:
Average Wage per Job for Counties a
- Page 228 and 229:
Average Wage per Job for Counties a
- Page 230 and 231:
Energy December 2002 Kansas Statist
- Page 232 and 233:
Natural Gas Prices for Kansas 1997
- Page 234 and 235:
Prices Energy Prices and Expenditur
- Page 236 and 237:
State and Local Government December
- Page 238 and 239:
State General Fund Comparative Stat
- Page 240 and 241:
Revenue and Expenditure of Local Go
- Page 242 and 243:
Revenue and Expenditure of State Go
- Page 244 and 245:
Public Employment Data, Kansas Stat
- Page 246 and 247:
Summary of Bonds, Temporary Notes,
- Page 248 and 249:
Summary of Bonds, Temporary Notes,
- Page 250 and 251:
Sales Tax Collectons by Kansas Coun
- Page 252 and 253:
Sales Tax Collectons by Kansas Coun
- Page 254 and 255:
Per Capita Sales Tax Collections by
- Page 256 and 257:
StateSalesTaxperCapita,FiscalYear20
- Page 258 and 259:
Summary of Property Taxes Levied by
- Page 260 and 261:
Assessed Valuation and Taxes by Cou
- Page 262 and 263:
2001 County Tax Rates for 2002 Asse
- Page 264 and 265:
2001 Tax Rates for 2002 Kansas Citi
- Page 266 and 267:
Federal Government Expenditure by O
- Page 268 and 269:
Federal Government Expenditure by O
- Page 270 and 271:
Total Federal Government Expenditur
- Page 272 and 273:
Housing and Construction December 2
- Page 274 and 275:
Number of Housing Units by Counties
- Page 276 and 277:
Housing Characteristics by County,
- Page 278 and 279:
Selected Housing Characteristics by
- Page 280 and 281:
Selected Housing Characteristics by
- Page 282 and 283:
House Heating Fuel, by County 2000
- Page 284 and 285:
Specified Owner - Occupied Housing
- Page 286 and 287:
Specified Renter - Occupied Housing
- Page 288 and 289:
County Occupied Housing Units and P
- Page 290 and 291:
New Privately-Owned Housing Units A
- Page 292 and 293:
Permit Authorized Construction in K
- Page 294 and 295:
Value of Construction Permits Issue
- Page 296 and 297:
Income December 2002 Kansas Statist
- Page 298 and 299:
Total Personal Income by State and
- Page 300 and 301:
Total Personal Income by State and
- Page 302 and 303:
Kansas Personal Income by Source 19
- Page 304 and 305:
Kansas Personal Income by Major Sou
- Page 306 and 307:
Personal Income by Source by County
- Page 308 and 309:
Personal Income by Source by County
- Page 310 and 311:
Personal Income by Source by County
- Page 312 and 313:
Personal Income by Source by County
- Page 314 and 315:
Personal Income by Source by County
- Page 316 and 317:
Personal Income by Source by County
- Page 318 and 319:
Per Capita Personal Income and Pers
- Page 320 and 321:
Per Capita Income 1989 and 1999 and
- Page 322 and 323:
Per Capita Personal Income by Count
- Page 324 and 325:
Per Capita Personal Income by Count
- Page 326 and 327:
Median Income of Households by Stat
- Page 328 and 329:
Estimated Median Household Income f
- Page 330 and 331:
Median Income, Kansas and Kansas Co
- Page 332 and 333:
Percent of People in Poverty by Sta
- Page 334 and 335:
Poverty Status by State in 2001, Pe
- Page 336 and 337:
Estimates of People of All Ages in
- Page 338 and 339:
Estimates of Related Children Age 5
- Page 340 and 341:
Estimates of People Under Age 18 in
- Page 342 and 343:
Food Stamp Beneficiaries and Expend
- Page 344 and 345:
Food Stamp Beneficiaries and Expend
- Page 346 and 347:
Nonfuel Raw Mineral Production and
- Page 348 and 349:
Oil Production in Kansas 1889-2001,
- Page 350 and 351:
KansasGasProductionbyCounty,2001 (i
- Page 352 and 353:
Kansas Oil Production and Number of
- Page 354 and 355:
Parks and Recreation December 2002
- Page 356 and 357:
Visitation Data and Size of State P
- Page 358 and 359:
Number and Value of Hunting and Fis
- Page 360 and 361:
Allen Anderson Atchison Barber Bart
- Page 362 and 363:
Population of Kansas by Age Group a
- Page 364 and 365:
Both Sexes Population of Kansas by
- Page 366 and 367:
Projections of the Population of Ka
- Page 368 and 369:
Population Summary for Congressiona
- Page 370 and 371:
Race and Hispanic Origin by Congres
- Page 372 and 373:
Population of Kansas Counties, Cens
- Page 374 and 375:
Population of Kansas Counties, 1980
- Page 376 and 377:
Population of Kansas Counties, 1990
- Page 378 and 379:
Population of Kansas Counties, 1990
- Page 380 and 381:
County Population of Kansas Countie
- Page 382 and 383:
Population Estimates for Counties a
- Page 384 and 385:
Population Estimates for Counties a
- Page 386 and 387:
Population Change in Kansas and Net
- Page 388 and 389:
Population Projections of Kansas Co
- Page 390 and 391:
Population Projections of Kansas Co
- Page 392 and 393:
Age by County, in Kansas, 2000 All
- Page 394 and 395:
Age by County, in Kansas, 1990 All
- Page 396 and 397:
Median Age of Persons in Kansas Cou
- Page 398 and 399:
Population Projections of People Ag
- Page 400 and 401:
Population Projections of People Ag
- Page 402 and 403:
Population Projections of People Ag
- Page 404 and 405:
Population Projections of People Ag
- Page 406 and 407:
Population Projections of People Ag
- Page 408 and 409:
Land Area and Population Density in
- Page 410 and 411:
County Male 1990 Population of Kans
- Page 412 and 413:
Urban and Rural Population by Count
- Page 414 and 415:
Urban and Rural Population by Count
- Page 416 and 417:
Percentage of Urban Population in K
- Page 418 and 419:
Land Area by Urban and Rural Reside
- Page 420 and 421:
Hispanic Population of Kansas Count
- Page 422 and 423:
Population of Counties by Race Apri
- Page 424 and 425:
Population of Counties by Race Apri
- Page 426 and 427:
Population of Metropolitan Areas 20
- Page 428 and 429:
Population of Urban Places of 10,00
- Page 430 and 431:
Population of Incorporated Places i
- Page 432 and 433:
Population of Incorporated Places i
- Page 434 and 435:
Population of Incorporated Places i
- Page 436 and 437:
Population of Kansas Cities, 1990 a
- Page 438 and 439:
Population of Kansas Cities, 1990 a
- Page 440 and 441:
Population of Kansas Cities, 1990 a
- Page 442 and 443:
Population of Kansas Cities, 1990 a
- Page 444 and 445:
Population of Kansas Cities, 1990 a
- Page 446 and 447:
Population of Kansas Cities, 1990 a
- Page 448 and 449:
Population of Kansas Cities, 1990 a
- Page 450 and 451:
Population of Kansas Cities, 1990 a
- Page 452 and 453:
Population of Kansas Cities, 1990 a
- Page 454 and 455:
Group Quarters Population by County
- Page 456 and 457:
Persons, Households, and Families i
- Page 458 and 459:
Number of Households by County 1990
- Page 460 and 461:
Kansas Transportation at a Glance,
- Page 462 and 463:
Expenditure of Federal Funds Admini
- Page 464 and 465:
State Motor Fuel Tax Rates* 2000 Ga
- Page 466 and 467:
Number of Vehicle Registrations in
- Page 468 and 469:
Kansas Motor Vehicle Registration b
- Page 470 and 471:
Special City & County Highway Fund
- Page 472 and 473:
Commuting to Work: 2000 Percent of
- Page 474 and 475:
Commuting to Work: 2000 Percent of
- Page 476 and 477:
Registered Live Births, Deaths, Mar
- Page 478 and 479:
Marriages, Divorces and Annulments
- Page 480 and 481:
Live Births and Deaths by County of
- Page 482 and 483:
Reported Abortions by Age Group of
- Page 484 and 485:
Hospitals in Kansas by County, 2000
- Page 486 and 487:
Allen Anderson Atchison Barber Bart
- Page 488 and 489:
Practicing Physicians in Kansas by
- Page 490 and 491:
Allen 1.06 Anderson 1.10 Atchison 2
- Page 492 and 493:
Active Dentists in Kansas by County
- Page 494 and 495:
Allen 0.42 Anderson 0.37 Atchison 0
- Page 496 and 497:
Child Care Facilities by County Oct
- Page 498 and 499:
County Adult Care Homes in Kansas b
- Page 500 and 501:
Cancer Death Rates Per 10,000 Popul
- Page 502 and 503:
Source:PolicyResearchInstitute;Kans
- Page 504 and 505:
Low Income Uninsured Children by St
- Page 506 and 507:
Quick link to: A B C D E F G H I J
- Page 508 and 509:
- D - Dairy products: production an
- Page 510 and 511:
Highway funds, 470 Highways and str
- Page 512 and 513:
population growth, 379 precipitatio
- Page 514 and 515:
climate, 108, 109, 110 land in farm
- Page 516:
deaths, 476, 479 divorces, 476, 477