- Page 1 and 2: Kansas Statistical Abstract 2001 36
- Page 3 and 4: Table of Contents Foreword ........
- Page 5 and 6: Education (con’t) Percent High Sc
- Page 7 and 8: Housing and Construction (con’t)
- Page 9 and 10: Transportation (con’t) Expenditur
- Page 11 and 12: Preface Special thanks are owed to
- Page 13 and 14: County Rankings December 2002 Kansa
- Page 15 and 16: Selected County Population Rankings
- Page 17 and 18: Selected County Rankings Per Capita
- Page 19 and 20: Selected County Rankings Per Capita
- Page 21 and 22: State Summary, 2000 Acres Acres Yie
- Page 24 and 25: Thousands 100 NumberofFarmsinKansas
- Page 26 and 27: Land Area and Proportion in Farms 1
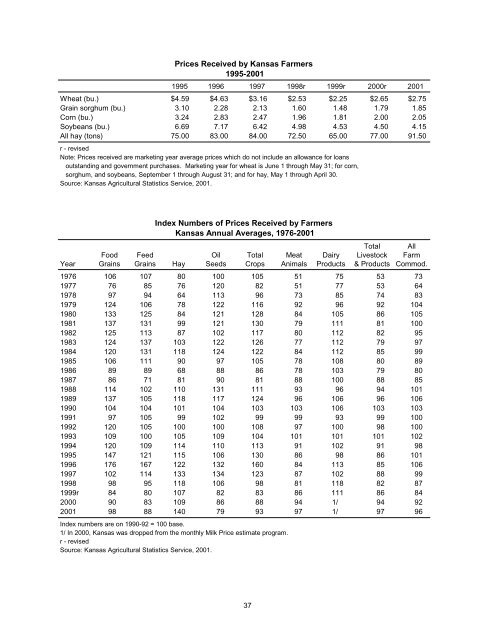
- Page 28 and 29: Farm, Crop and Livestock Informatio
- Page 30 and 31: Farm, Crop and Livestock Informatio
- Page 32 and 33: Agriculture Industry Production In
- Page 34 and 35: Farm Value of Kansas Livestock and
- Page 38 and 39: ThousandsofDollars 35 30 25 20 Aver
- Page 40 and 41: Crops Percentage of Farm Cash Recei
- Page 42 and 43: Total Loans/Total Assets and Net Fa
- Page 44 and 45: Banking and Finance December 2002 K
- Page 46 and 47: Bank Deposits in Kansas by County F
- Page 48 and 49: Banking Growth in Kansas 1949-2001
- Page 50 and 51: New Firms by State, 1995-2000 Perce
- Page 52 and 53: Self-Employment by State, 1995-2000
- Page 54 and 55: Hispanic-Owned Businesses in Kansas
- Page 56 and 57: Women-Owned Businesses in Kansas, 1
- Page 58 and 59: Manufacturing in Kansas 1998r All e
- Page 60 and 61: Manufacturing in Kansas 2000 All em
- Page 62 and 63: Kind of Business Retail Trade in Ka
- Page 64 and 65: Wholesale Trade in Kansas, 1997 Typ
- Page 66 and 67: Total Annual Payroll ($1,000) by In
- Page 68 and 69: Total Annual Payroll ($1,000) by In
- Page 70 and 71: Total Annual Payroll ($1,000) by In
- Page 72 and 73: Total Annual Payroll ($1,000) by In
- Page 74 and 75: Total Annual Payroll ($1,000) by In
- Page 76 and 77: Total Annual Payroll ($1,000) by In
- Page 78 and 79: Number of Establishments by Industr
- Page 80 and 81: Number of Establishments by Industr
- Page 82 and 83: Number of Establishments by Industr
- Page 84 and 85: Number of Establishments by Industr
- Page 86 and 87:
Number of Establishments by Industr
- Page 88 and 89:
Number of Establishments by Industr
- Page 90 and 91:
Taxable Retail Sales, by County 199
- Page 92 and 93:
Taxable Retail Sales, by County 199
- Page 94 and 95:
Taxable Retail Sales, by County 199
- Page 96 and 97:
Taxable Retail Sales, by County 199
- Page 98 and 99:
Taxable Retail Sales, by County 199
- Page 100 and 101:
County Trade Pull Factors* FY 1990-
- Page 102 and 103:
Value Value Value Rank Country 1999
- Page 104 and 105:
Kansas Gross State Product by Indus
- Page 106 and 107:
Patent Grants by County, 1990-1999
- Page 108 and 109:
KansasRegionalTemperatures,2000 Jan
- Page 110 and 111:
Precipitation in Kansas, 2000 and A
- Page 112 and 113:
Kansas County Precipitation 1997-20
- Page 114 and 115:
Communications December 2002 Kansas
- Page 116 and 117:
Daily Newspapers of Kansas, 1993-20
- Page 118 and 119:
Daily Newspapers of Kansas, 1993-20
- Page 120 and 121:
Total Crime Index Offenses in Kansa
- Page 122 and 123:
Crime Index Offenses by County* 199
- Page 124 and 125:
Arrests by County 1995-1998 County
- Page 126 and 127:
Admissions and Releases All Institu
- Page 128 and 129:
Inmate Characteristics in Correctio
- Page 130 and 131:
Number of Full-Time Law Enforcement
- Page 132 and 133:
Allen Anderson Atchison Barber Bart
- Page 134 and 135:
Number of Accredited Public Schools
- Page 136 and 137:
High School Graduates by County, by
- Page 138 and 139:
Percent High School Graduate or Hig
- Page 140 and 141:
County Headcount Grades 7-12 High S
- Page 142 and 143:
Pupil-Teacher Ratio by County, 2001
- Page 144 and 145:
Kansas School Districts: 2001 Schoo
- Page 146 and 147:
Kansas School Districts: 2001 Schoo
- Page 148 and 149:
Kansas School Districts: 2001 Schoo
- Page 150 and 151:
Current Expenditure Per Pupil in Pu
- Page 152 and 153:
Kansas School Districts: Estimates
- Page 154 and 155:
Kansas School Districts: Estimates
- Page 156 and 157:
Kansas School Districts: Estimates
- Page 158 and 159:
Kansas School Districts: Estimates
- Page 160 and 161:
Enrollment in Kansas' Four-Year Col
- Page 162 and 163:
Enrollment in Kansas' Four-Year Col
- Page 164 and 165:
Enrollment in Kansas' Technical Col
- Page 166 and 167:
County Less than 9th Grade 9-12th G
- Page 168 and 169:
Public Library Materials by State,
- Page 170 and 171:
Public Library Service by State, FY
- Page 172 and 173:
Public Library Service by State, FY
- Page 174 and 175:
Public Libraries Providing Access t
- Page 176 and 177:
Elections December 2002 Kansas Stat
- Page 178 and 179:
Allen Anderson Atchison Barber Bart
- Page 180 and 181:
Kansas General Election Statistics
- Page 182 and 183:
County Kansas General Election Stat
- Page 184 and 185:
Kansas General Election Statistics
- Page 186 and 187:
County Kansas General Election Stat
- Page 188 and 189:
Kansas General Election Statistics
- Page 190 and 191:
Kansas General Election Statistics
- Page 192 and 193:
Voter Registration and Party Affili
- Page 194 and 195:
Civilian Labor Force in Kansas 1950
- Page 196 and 197:
Civilian Labor Force Estimates by C
- Page 198 and 199:
Civilian Labor Force Estimates by C
- Page 200 and 201:
MillionsofPersons 1.44 1.42 1.40 1.
- Page 202 and 203:
Unemployment Rates in Kansas by Cou
- Page 204 and 205:
ThousandsofPersons 70 KansasUnemplo
- Page 206 and 207:
Kansas Labor Market Summary 2000 an
- Page 208 and 209:
Employment Data for Metropolitan St
- Page 210 and 211:
Mid-March Employment by Industry, 1
- Page 212 and 213:
Mid-March Employment by Industry, 1
- Page 214 and 215:
Mid-March Employment by Industry, 1
- Page 216 and 217:
Mid-March Employment by Industry, 2
- Page 218 and 219:
County Real Estate Prof. Sci.& Admi
- Page 220 and 221:
Mid-March Employment by Industry, 2
- Page 222 and 223:
Farm and Nonfarm Employees* by Coun
- Page 224 and 225:
State Average Annual Pay for 1999 a
- Page 226 and 227:
Average Wage per Job for Counties a
- Page 228 and 229:
Average Wage per Job for Counties a
- Page 230 and 231:
Energy December 2002 Kansas Statist
- Page 232 and 233:
Natural Gas Prices for Kansas 1997
- Page 234 and 235:
Prices Energy Prices and Expenditur
- Page 236 and 237:
State and Local Government December
- Page 238 and 239:
State General Fund Comparative Stat
- Page 240 and 241:
Revenue and Expenditure of Local Go
- Page 242 and 243:
Revenue and Expenditure of State Go
- Page 244 and 245:
Public Employment Data, Kansas Stat
- Page 246 and 247:
Summary of Bonds, Temporary Notes,
- Page 248 and 249:
Summary of Bonds, Temporary Notes,
- Page 250 and 251:
Sales Tax Collectons by Kansas Coun
- Page 252 and 253:
Sales Tax Collectons by Kansas Coun
- Page 254 and 255:
Per Capita Sales Tax Collections by
- Page 256 and 257:
StateSalesTaxperCapita,FiscalYear20
- Page 258 and 259:
Summary of Property Taxes Levied by
- Page 260 and 261:
Assessed Valuation and Taxes by Cou
- Page 262 and 263:
2001 County Tax Rates for 2002 Asse
- Page 264 and 265:
2001 Tax Rates for 2002 Kansas Citi
- Page 266 and 267:
Federal Government Expenditure by O
- Page 268 and 269:
Federal Government Expenditure by O
- Page 270 and 271:
Total Federal Government Expenditur
- Page 272 and 273:
Housing and Construction December 2
- Page 274 and 275:
Number of Housing Units by Counties
- Page 276 and 277:
Housing Characteristics by County,
- Page 278 and 279:
Selected Housing Characteristics by
- Page 280 and 281:
Selected Housing Characteristics by
- Page 282 and 283:
House Heating Fuel, by County 2000
- Page 284 and 285:
Specified Owner - Occupied Housing
- Page 286 and 287:
Specified Renter - Occupied Housing
- Page 288 and 289:
County Occupied Housing Units and P
- Page 290 and 291:
New Privately-Owned Housing Units A
- Page 292 and 293:
Permit Authorized Construction in K
- Page 294 and 295:
Value of Construction Permits Issue
- Page 296 and 297:
Income December 2002 Kansas Statist
- Page 298 and 299:
Total Personal Income by State and
- Page 300 and 301:
Total Personal Income by State and
- Page 302 and 303:
Kansas Personal Income by Source 19
- Page 304 and 305:
Kansas Personal Income by Major Sou
- Page 306 and 307:
Personal Income by Source by County
- Page 308 and 309:
Personal Income by Source by County
- Page 310 and 311:
Personal Income by Source by County
- Page 312 and 313:
Personal Income by Source by County
- Page 314 and 315:
Personal Income by Source by County
- Page 316 and 317:
Personal Income by Source by County
- Page 318 and 319:
Per Capita Personal Income and Pers
- Page 320 and 321:
Per Capita Income 1989 and 1999 and
- Page 322 and 323:
Per Capita Personal Income by Count
- Page 324 and 325:
Per Capita Personal Income by Count
- Page 326 and 327:
Median Income of Households by Stat
- Page 328 and 329:
Estimated Median Household Income f
- Page 330 and 331:
Median Income, Kansas and Kansas Co
- Page 332 and 333:
Percent of People in Poverty by Sta
- Page 334 and 335:
Poverty Status by State in 2001, Pe
- Page 336 and 337:
Estimates of People of All Ages in
- Page 338 and 339:
Estimates of Related Children Age 5
- Page 340 and 341:
Estimates of People Under Age 18 in
- Page 342 and 343:
Food Stamp Beneficiaries and Expend
- Page 344 and 345:
Food Stamp Beneficiaries and Expend
- Page 346 and 347:
Nonfuel Raw Mineral Production and
- Page 348 and 349:
Oil Production in Kansas 1889-2001,
- Page 350 and 351:
KansasGasProductionbyCounty,2001 (i
- Page 352 and 353:
Kansas Oil Production and Number of
- Page 354 and 355:
Parks and Recreation December 2002
- Page 356 and 357:
Visitation Data and Size of State P
- Page 358 and 359:
Number and Value of Hunting and Fis
- Page 360 and 361:
Allen Anderson Atchison Barber Bart
- Page 362 and 363:
Population of Kansas by Age Group a
- Page 364 and 365:
Both Sexes Population of Kansas by
- Page 366 and 367:
Projections of the Population of Ka
- Page 368 and 369:
Population Summary for Congressiona
- Page 370 and 371:
Race and Hispanic Origin by Congres
- Page 372 and 373:
Population of Kansas Counties, Cens
- Page 374 and 375:
Population of Kansas Counties, 1980
- Page 376 and 377:
Population of Kansas Counties, 1990
- Page 378 and 379:
Population of Kansas Counties, 1990
- Page 380 and 381:
County Population of Kansas Countie
- Page 382 and 383:
Population Estimates for Counties a
- Page 384 and 385:
Population Estimates for Counties a
- Page 386 and 387:
Population Change in Kansas and Net
- Page 388 and 389:
Population Projections of Kansas Co
- Page 390 and 391:
Population Projections of Kansas Co
- Page 392 and 393:
Age by County, in Kansas, 2000 All
- Page 394 and 395:
Age by County, in Kansas, 1990 All
- Page 396 and 397:
Median Age of Persons in Kansas Cou
- Page 398 and 399:
Population Projections of People Ag
- Page 400 and 401:
Population Projections of People Ag
- Page 402 and 403:
Population Projections of People Ag
- Page 404 and 405:
Population Projections of People Ag
- Page 406 and 407:
Population Projections of People Ag
- Page 408 and 409:
Land Area and Population Density in
- Page 410 and 411:
County Male 1990 Population of Kans
- Page 412 and 413:
Urban and Rural Population by Count
- Page 414 and 415:
Urban and Rural Population by Count
- Page 416 and 417:
Percentage of Urban Population in K
- Page 418 and 419:
Land Area by Urban and Rural Reside
- Page 420 and 421:
Hispanic Population of Kansas Count
- Page 422 and 423:
Population of Counties by Race Apri
- Page 424 and 425:
Population of Counties by Race Apri
- Page 426 and 427:
Population of Metropolitan Areas 20
- Page 428 and 429:
Population of Urban Places of 10,00
- Page 430 and 431:
Population of Incorporated Places i
- Page 432 and 433:
Population of Incorporated Places i
- Page 434 and 435:
Population of Incorporated Places i
- Page 436 and 437:
Population of Kansas Cities, 1990 a
- Page 438 and 439:
Population of Kansas Cities, 1990 a
- Page 440 and 441:
Population of Kansas Cities, 1990 a
- Page 442 and 443:
Population of Kansas Cities, 1990 a
- Page 444 and 445:
Population of Kansas Cities, 1990 a
- Page 446 and 447:
Population of Kansas Cities, 1990 a
- Page 448 and 449:
Population of Kansas Cities, 1990 a
- Page 450 and 451:
Population of Kansas Cities, 1990 a
- Page 452 and 453:
Population of Kansas Cities, 1990 a
- Page 454 and 455:
Group Quarters Population by County
- Page 456 and 457:
Persons, Households, and Families i
- Page 458 and 459:
Number of Households by County 1990
- Page 460 and 461:
Kansas Transportation at a Glance,
- Page 462 and 463:
Expenditure of Federal Funds Admini
- Page 464 and 465:
State Motor Fuel Tax Rates* 2000 Ga
- Page 466 and 467:
Number of Vehicle Registrations in
- Page 468 and 469:
Kansas Motor Vehicle Registration b
- Page 470 and 471:
Special City & County Highway Fund
- Page 472 and 473:
Commuting to Work: 2000 Percent of
- Page 474 and 475:
Commuting to Work: 2000 Percent of
- Page 476 and 477:
Registered Live Births, Deaths, Mar
- Page 478 and 479:
Marriages, Divorces and Annulments
- Page 480 and 481:
Live Births and Deaths by County of
- Page 482 and 483:
Reported Abortions by Age Group of
- Page 484 and 485:
Hospitals in Kansas by County, 2000
- Page 486 and 487:
Allen Anderson Atchison Barber Bart
- Page 488 and 489:
Practicing Physicians in Kansas by
- Page 490 and 491:
Allen 1.06 Anderson 1.10 Atchison 2
- Page 492 and 493:
Active Dentists in Kansas by County
- Page 494 and 495:
Allen 0.42 Anderson 0.37 Atchison 0
- Page 496 and 497:
Child Care Facilities by County Oct
- Page 498 and 499:
County Adult Care Homes in Kansas b
- Page 500 and 501:
Cancer Death Rates Per 10,000 Popul
- Page 502 and 503:
Source:PolicyResearchInstitute;Kans
- Page 504 and 505:
Low Income Uninsured Children by St
- Page 506 and 507:
Quick link to: A B C D E F G H I J
- Page 508 and 509:
- D - Dairy products: production an
- Page 510 and 511:
Highway funds, 470 Highways and str
- Page 512 and 513:
population growth, 379 precipitatio
- Page 514 and 515:
climate, 108, 109, 110 land in farm
- Page 516:
deaths, 476, 479 divorces, 476, 477