Optimal Design of Elastomer Composites for ... - Michael I Friswell
Optimal Design of Elastomer Composites for ... - Michael I Friswell
Optimal Design of Elastomer Composites for ... - Michael I Friswell

Create successful ePaper yourself
Turn your PDF publications into a flip-book with our unique Google optimized e-Paper software.
Volume fraction (%)<br />
Volume fraction (%)<br />
90<br />
80<br />
70<br />
60<br />
50<br />
40<br />
30<br />
20<br />
Plate L/B ratio 1.0<br />
First ply<br />
Second ply<br />
10<br />
1 2 3 4 5 6 7 8 9<br />
No. <strong>of</strong> segments<br />
90<br />
80<br />
70<br />
60<br />
50<br />
40<br />
30<br />
(a)<br />
Plate L/B ratio 1.3<br />
First ply<br />
Second ply<br />
<strong>of</strong> uni<strong>for</strong>m fiber distribution case is given in Table 5.<br />
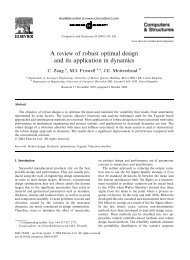
The optimal fiber distribution <strong>of</strong> the first and second ply layers<br />
follows a parabolic type distribution <strong>for</strong> the AR <strong>of</strong> 1.0 and 1.3.<br />
For the AR <strong>of</strong> 2.0, the first ply is almost 60% VF and the second<br />
ply is 20% VF. However, the plies <strong>of</strong> AR 4.0 follow corrugated<br />
type distributions with 60% VF <strong>for</strong> the first ply and 20% VF<br />
<strong>for</strong> the second ply. Table 4 shows that the parabolic and corrugated<br />
type distributions have better flexibility and bending stiffness<br />
compared to the uni<strong>for</strong>m fiber distribution. The FR ratio <strong>for</strong><br />
the optimal results show an increase <strong>of</strong> 31 to 47% from the uni<strong>for</strong>m<br />
fiber distribution as given in Table 5. Also, the FR <strong>for</strong> the<br />
optimal results <strong>of</strong> case I show an increase <strong>of</strong> 27 to 40% and the<br />
60/20 VF case shows an increase <strong>of</strong> 29% from the uni<strong>for</strong>m fiber<br />
distribution.<br />
TABLE 4. FLEXIBILITY RATIO (FR=δ/∆ ∗ 100) FOR VARIABLE<br />
FIBER DISTRIBUTIONS<br />
20<br />
Volume fraction (%)<br />
10<br />
1 2 3 4 5 6 7 8 9<br />
No. <strong>of</strong> segments<br />
90<br />
80<br />
70<br />
60<br />
50<br />
40<br />
30<br />
20<br />
(b)<br />
Plate L/B ratio 2.0<br />
First ply<br />
Second ply<br />
Plate L/B (FR) 40 (FR) 60/20 <strong>Optimal</strong> <strong>Optimal</strong><br />
ratio case I, case II<br />
1.0 9.1177 11.7807 11.8038 12.5530<br />
1.3 10.0894 13.1089 14.2684 14.9080<br />
2.0 15.4054 20.0147 21.6622 21.8947<br />
4.0 30.9345 40.1732 39.5447 40.6432<br />
10<br />
2 4 6 8<br />
No. <strong>of</strong> segments<br />
(c)<br />
Volume fraction (%)<br />
90<br />
80<br />
70<br />
60<br />
50<br />
40<br />
30<br />
20<br />
Plate L/B ratio 4.0<br />
First ply<br />
Second ply<br />
10<br />
1 2 3 4 5 6 7 8 9<br />
No. <strong>of</strong> segments<br />
(d)<br />
FIGURE 9. OPTIMAL DISTRIBUTION OF VOLUME FRACTION<br />
OF FIBERS, CASE I.<br />
TABLE 5. PERCENT INCREASE IN FLEXIBILITY RATIO FOR<br />
VARIABLE FIBER DISTRIBUTIONS<br />
Plate L/B (FR) 60/20 <strong>Optimal</strong> <strong>Optimal</strong><br />
ratio case I, case II<br />
1.0 29.21 29.46 37.68<br />
1.3 29.93 41.42 47.76<br />
2.0 29.92 40.61 42.12<br />
4.0 29.87 27.83 31.38<br />
ness, measures the in-plane flexibility <strong>for</strong> an unit out-<strong>of</strong>-plane<br />
bending stiffness. The FR ratio is given <strong>for</strong> the optimization results<br />
<strong>of</strong> case I and II, the 60/20 VF case and the uni<strong>for</strong>m fiber<br />
distribution case in Table 4. Similarly, the percentage increase in<br />
the FR <strong>of</strong> optimal results and the 60/20 VF case compared to that<br />
In addition to the above results, the FR <strong>of</strong> the laminate with<br />
a uni<strong>for</strong>m distribution <strong>of</strong> VF <strong>of</strong> fibers varying from 20 to 60% is<br />
shown in Fig. 11. The results show that the FR increases with<br />
8 Copyright c⃝ 2011 by ASME