The Geometry The Nucleus
The Geometry The Nucleus
The Geometry The Nucleus

Create successful ePaper yourself
Turn your PDF publications into a flip-book with our unique Google optimized e-Paper software.
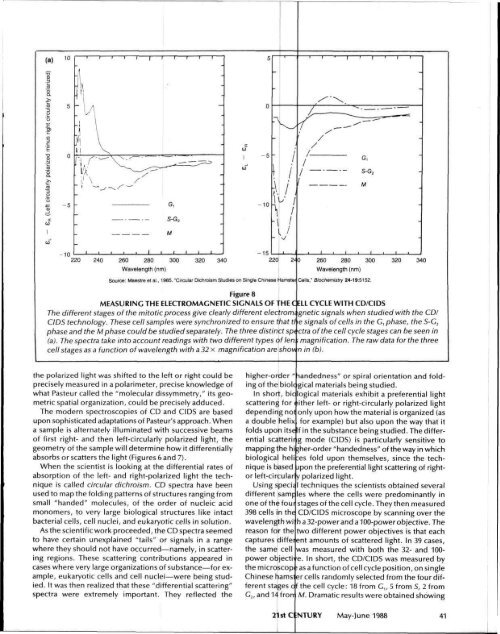
Figure 8<br />
MEASURING THE ELECTROMAGNETIC SIGNALS OF THE C ELL CYCLE WITH CD/CIDS<br />
<strong>The</strong> different stages of the mitotic process give clearly different electrorm gnetic signals when studied with the CD/<br />
CIDS technology. <strong>The</strong>se cell samples were synchronized to ensure that tl e signals of cells in the G, phase, the 5-G 2<br />
phase and the M phase could be studied separately. <strong>The</strong> three distinct sp< ctra of the cell cycle stages can be seen in<br />
(a). <strong>The</strong> spectra take into account readings with two different types oflen ; magnification. <strong>The</strong> raw data forthe three<br />
cell stages as a function of wavelength with a32x magnification are show n in (b).<br />
the polarized light was shifted to the left or right could be<br />
precisely measured in a polarimeter, precise knowledge of<br />
what Pasteur called the "molecular dissymmetry," its geometric<br />
spatial organization, could be precisely adduced.<br />
<strong>The</strong> modern spectroscopies of CD and CIDS are based<br />
upon sophisticated adaptations of Pasteur's approach. When<br />
a sample is alternately illuminated with successive beams<br />
of first right- and then left-circularly polarized light, the<br />
geometry of the sample will determine how it differentially<br />
absorbs or scatters the light (Figures 6and 7).<br />
When the scientist is looking at the differential rates of<br />
absorption of the left- and right-polarized light the technique<br />
is called circular dichroism. CD spectra have been<br />
used to map the folding patterns of structures ranging from<br />
small "handed" molecules, of the order of nucleic acid<br />
monomers, to very large biological structures like intact<br />
bacterial cells, cell nuclei, and eukaryotic cells in solution.<br />
As the scientific work proceeded, the CD spectra seemed<br />
to have certain unexplained "tails" or signals in a range<br />
where they should not have occurred—namely, in scattering<br />
regions. <strong>The</strong>se scattering contributions appeared in<br />
cases where very large organizations of substance—for example,<br />
eukaryotic cells and cell nuclei—were being studied.<br />
It was then realized that these "differential scattering"<br />
spectra were extremely important. <strong>The</strong>y reflected the<br />
higher-order " landedness" or spiral orientation and folding<br />
of the biolc gical materials being studied.<br />
In short, bic logical materials exhibit a preferential light<br />
scattering for cither left- or right-circularly polarized light<br />
depending not only upon how the material is organized (as<br />
a double helix for example) but also upon the way that it<br />
folds upon itse If in the substance being studied. <strong>The</strong> differential<br />
scatterir g mode (CIDS) is particularly sensitive to<br />
mapping the hi *her-order "handedness" of the way in which<br />
biological heli :es fold upon themselves, since the technique<br />
is based jpon the preferential light scattering of rightor<br />
left-circular y polarized light.<br />
Using speci; I techniques the scientists obtained several<br />
different samples where the cells were predominantly in<br />
one of the foui stages of the cell cycle. <strong>The</strong>y then measured<br />
398 cells in the CD/CIDS microscope by scanning over the<br />
wavelength wi h a 32-power and a 100-power objective. <strong>The</strong><br />
reason for the two different power objectives is that each<br />
captures different amounts of scattered light. In 39 cases,<br />
the same cell was measured with both the 32- and 100-<br />
power objective. In short, the CD/CIDS was measured by<br />
the microscop ! as a function of cell cycle position, on single<br />
Chinese hams! er cells randomly selected from the four different<br />
stages c f the cell cycle: 18 from G„ 5 from S, 2 from<br />
C 2I and 14 f ron M. Dramatic results were obtained showing<br />
21stClNTURY May-June 1988 41