The Geometry The Nucleus
The Geometry The Nucleus
The Geometry The Nucleus

Create successful ePaper yourself
Turn your PDF publications into a flip-book with our unique Google optimized e-Paper software.
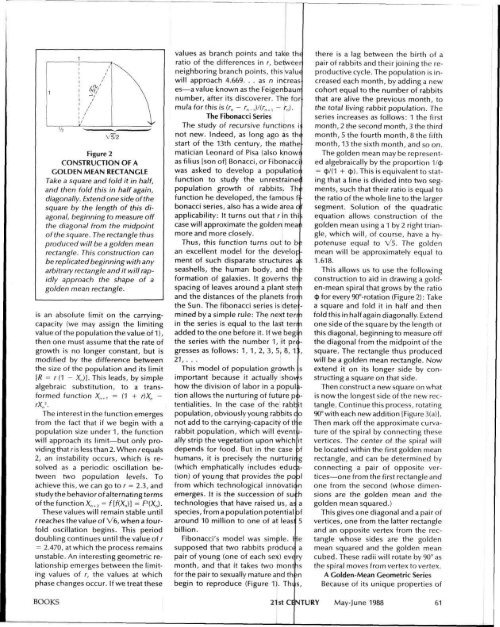
Figure 2<br />
CONSTRUCTION OF A<br />
GOLDEN MEAN RECTANGLE<br />
Take a square and fold it in half,<br />
and then fold this in half again,<br />
diagonally. Extend one side of the<br />
square by the length of this diagonal,<br />
beginning to measure off<br />
the diagonal from the midpoint<br />
of the square. <strong>The</strong> rectangle thus<br />
produced will be a golden mean<br />
rectangle. This construction can<br />
be replicated beginning with any<br />
arbitrary rectangle and it will rapidly<br />
approach the shape of a<br />
golden mean rectangle.<br />
is an absolute limit on the carryingcapacity<br />
(we may assign the limiting<br />
value of the population the value of 1),<br />
then one must assume that the rate of<br />
growth is no longer constant, but is<br />
modified by the difference between<br />
the size of the population and its limit<br />
[R = r (1 - X„)]. This leads, by simple<br />
algebraic substitution, to a transformed<br />
function X„ +1 = (1 + r)X„ -<br />
rX n 2 .<br />
<strong>The</strong> interest in the function emerges<br />
from the fact that if we begin with a<br />
population size under 1, the function<br />
will approach its limit—but only providing<br />
that ris less than 2. When /-equals<br />
2, an instability occurs, which is resolved<br />
as a periodic oscillation between<br />
two population levels. To<br />
achieve this, we can go to r = 2.3, and<br />
study the behavior of alternating terms<br />
of the function X n+2 = f[f(X n )] = P(X„).<br />
<strong>The</strong>se values will remain stable until<br />
r reaches the value of V6, when a fourfold<br />
oscillation begins. This period<br />
doubling continues until the value of r<br />
= 2.470, at which the process remains<br />
unstable. An interesting geometric relationship<br />
emerges between the limiting<br />
values of r, the values at which<br />
phase changes occur. If we treat these<br />
values as branch points and take the<br />
ratio of the differences in r, betweer<br />
neighboring branch points, this value<br />
will approach 4.669. . . as n increas<br />
es—a value known as the Feigenbaurr<br />
number, after its discoverer. <strong>The</strong> for<br />
mula for this is (r„ - r„_,)/(r n +, - k).<br />
<strong>The</strong> Fibonacci Series<br />
<strong>The</strong> study of recursive functions i<br />
not new. Indeed, as long ago as the<br />
start of the 13th century, the mathe<br />
matician Leonard of Pisa (also knowr<br />
as filius [son of] Bonacci, or Fibonacci<br />
was asked to develop a population<br />
function to study the unrestrained<br />
population growth of rabbits. Th!<br />
function he developed, the famous fibonacci<br />
series, also has a wide area o f<br />
applicability: It turns out that r in thi;<br />
case will approximate the golden meai i<br />
more and more closely.<br />
Thus, this function turns out to b s<br />
an excellent model for the development<br />
of such disparate structures as<br />
seashells, the human body, and th;<br />
formation of galaxies. It governs th s<br />
spacing of leaves around a plant sten<br />
and the distances of the planets fror i<br />
the Sun. <strong>The</strong> fibonacci series is dete -<br />
mined by a simple rule: <strong>The</strong> next terr i<br />
in the series is equal to the last tern<br />
added to the one before it. If we begi i<br />
the series with the number 1, it progresses<br />
as follows: 1,1, 2, 3, 5, 8, 1!l,<br />
21,...<br />
This model of population growth s<br />
important because it actually shov s<br />
how the division of labor in a popul >-<br />
tion allows the nurturing of future p< >-<br />
tentialities. In the case of the rabr.it<br />
population, obviously young rabbits c o<br />
not add to the carrying-capacity of tl e<br />
rabbit population, which will event I-<br />
ally strip the vegetation upon which it<br />
depends for food. But in the case >f<br />
humans, it is precisely the nurturii g<br />
(which emphatically includes education)<br />
of young that provides the poal<br />
from which technological innovatic n<br />
emerges. It is the succession of su :h<br />
technologies that have raised us, a< a<br />
species, from a population potential :>f<br />
around 10 million to one of at leas^ I<br />
billion.<br />
Fibonacci's model was simple, ijie<br />
supposed that two rabbits produce<br />
pair of young (one of each sex) eve ry<br />
month, and that it takes two montis<br />
for the pair to sexually mature and th ;n<br />
begin to reproduce (Figure 1). Thi s,<br />
there is a lag between the birth of a<br />
pair of rabbits and their joining the reproductive<br />
cycle. <strong>The</strong> population is increased<br />
each month, by adding a new<br />
cohort equal to the number of rabbits<br />
that are alive the previous month, to<br />
the total living rabbit population. <strong>The</strong><br />
series increases as follows: 1 the first<br />
month, 2 the second month, 3 the third<br />
month, 5 the fourth month, 8 the fifth<br />
month, 13 the sixth month, and so on.<br />
<strong>The</strong> golden mean may be represented<br />
algebraically by the proportion 1/$<br />
=