Salt Marsh Integrity Assessment Program in USFWS region 5
Salt Marsh Integrity Assessment Program in USFWS region 5
Salt Marsh Integrity Assessment Program in USFWS region 5

Create successful ePaper yourself
Turn your PDF publications into a flip-book with our unique Google optimized e-Paper software.
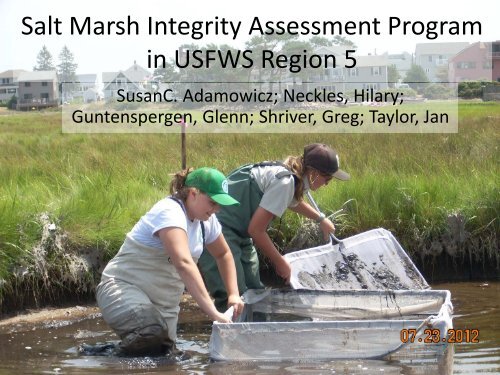
<strong>Salt</strong> <strong>Marsh</strong> <strong>Integrity</strong> <strong>Assessment</strong> <strong>Program</strong><br />
<strong>in</strong> <strong>USFWS</strong> Region 5<br />
SusanC. Adamowicz; Neckles, Hilary;<br />
Guntenspergen, Glenn; Shriver, Greg; Taylor, Jan
Background<br />
• <strong>USFWS</strong> Region 5 National<br />
Wildlife Refuges<br />
• Refuge purposes…..<br />
– Threatened &<br />
Endangered Species<br />
– Migratory Birds<br />
– Wilderness<br />
– Shorebirds & Wad<strong>in</strong>g Birds<br />
– Encourage Natural<br />
Diversity<br />
– Conservation of Wetlands
Background cont.<br />
• US FWS has series of unrelated research<br />
projects but no common basel<strong>in</strong>e assessment<br />
Fundulus heteroclitus Length (mm)<br />
Before After 1 yr After 2+ yr<br />
Konisky et al. 2004
Background cont.<br />
• Desire for more<br />
<strong>in</strong>formed<br />
management<br />
decision mak<strong>in</strong>g<br />
at local and<br />
<strong>region</strong>al level<br />
Scott Kahan<br />
Refuge<br />
Manager<br />
Regional<br />
Refuge<br />
Chief<br />
Regional<br />
Director<br />
Wendi Weber<br />
Regional Natural<br />
Resources Chief<br />
Refuge<br />
Biologist<br />
Jan Taylor
Structured<br />
Decision<br />
Mak<strong>in</strong>g<br />
PrOACT<br />
Problem Def<strong>in</strong>ition<br />
Objectives<br />
Action alternatives<br />
Consequences (Predictive model)<br />
Trade-offs/Optimization (Solution algorithm)<br />
Monitor<strong>in</strong>g<br />
Reference: Smart Choices by Hammond, Keeney, and Raiffa
PrOACT<br />
Problem Def<strong>in</strong>ition:<br />
• Identify <strong>in</strong>dicators of salt marsh <strong>in</strong>tegrity that are<br />
effective across large geographic <strong>region</strong>s, responsive to<br />
a wide range of threats, and feasible to implement<br />
with<strong>in</strong> fund<strong>in</strong>g and staff<strong>in</strong>g constra<strong>in</strong>ts of the NWRS<br />
• Management/restoration decisions made for a given<br />
refuge at 3- to 5-year time scales,<br />
• The ecological and geographic focus of this exercise<br />
was historically brackish and sal<strong>in</strong>e marshes dom<strong>in</strong>ated<br />
by halophytic vegetation <strong>in</strong> FWS Region 5 (Northeast)
PrOACT<br />
• Objectives:<br />
Biological Diversity<br />
and <strong>Integrity</strong><br />
Obligate <strong>Salt</strong><br />
<strong>Marsh</strong> Breed<strong>in</strong>g<br />
Birds<br />
Nonbreed<strong>in</strong>g<br />
Wetland Birds<br />
Native<br />
Nekton<br />
Community<br />
Native Veg<br />
Community<br />
Trophic<br />
Structure<br />
Tidal Regime<br />
and Hydrology<br />
Environmental<br />
Health<br />
Herbicide<br />
Applied Dur<strong>in</strong>g<br />
Mgt.<br />
Ma<strong>in</strong>ta<strong>in</strong><br />
<strong>Marsh</strong> Area
<strong>Salt</strong> <strong>Marsh</strong> <strong>Integrity</strong> Objectives Hierarchy<br />
Biological Diversity and <strong>Integrity</strong> (0.5)<br />
Environmental Health (0.5)<br />
Obligate <strong>Salt</strong><br />
<strong>Marsh</strong> Breed<strong>in</strong>g<br />
Birds (0.10)<br />
Nonbreed<strong>in</strong>g<br />
Wetland Birds<br />
(0.10)<br />
Native Nekton<br />
Community<br />
(0.09)<br />
Native Veg<br />
Community<br />
(0.12)<br />
Trophic Structure<br />
(0.09)<br />
Tidal Regime and<br />
Hydrology (0.22)<br />
Ma<strong>in</strong>ta<strong>in</strong> <strong>Marsh</strong><br />
Area (0.22)<br />
Herbicide Applied<br />
Dur<strong>in</strong>g Mgt.<br />
(0.06)<br />
Birds/po<strong>in</strong>t<br />
Ave ABDU w<strong>in</strong>ter<br />
abundance<br />
Nekton Density<br />
(#/m2) (0.045)<br />
% cover native<br />
spp.<br />
<strong>Marsh</strong> spiders<br />
per m2<br />
Flood<br />
Duration (0.11)<br />
Relative change<br />
marsh surface<br />
elevation<br />
P<strong>in</strong>ts<br />
Nekton Species<br />
Richness (0.045)<br />
Sal<strong>in</strong>ity (0.11)<br />
Objective<br />
Measureable Attribute
Desire for “Rapid” Assessement<br />
Method<br />
Intensive<br />
• Obligate <strong>Marsh</strong> Bird Nest<strong>in</strong>g<br />
Success<br />
• Vegetation Quadrats<br />
• Nekton Throw Traps& Ditch<br />
Nets<br />
• Groundwater Wells<br />
• GIS<br />
“Rapid”<br />
• Bird Po<strong>in</strong>t Counts/Callback<br />
• Vegetation Transects<br />
• Veg: Visual Community ID<br />
• M<strong>in</strong>now Traps<br />
• Water Level Loggers<br />
• GIS
Rapid Method “F<strong>in</strong>al” List<br />
Historical condition and geomorphic sett<strong>in</strong>g<br />
Landscape_position<br />
• Landscape position: 1 (mar<strong>in</strong>e), 2 (middleestuary),<br />
3 (upper-estuary)<br />
• Shape: 1 (expansive meadow), 2 (narrow<br />
fr<strong>in</strong>g<strong>in</strong>g marsh)<br />
• Fill/fragmentation: 1 (no), 2 (low), 3 (mod),<br />
4 (severe)<br />
• Tidal flush<strong>in</strong>g: 1 (well flushed),<br />
2 (moderately flushed), 3 (poorly flushed)<br />
• Aquatic edge: 1 (low), 2 (mod), 3 (high)<br />
• Ditch Density: 1 (no), 2 (low), 3 (mod),<br />
4 (severe)
Rapid Method “F<strong>in</strong>al” List cont.<br />
Surround<strong>in</strong>g land-use<br />
• % agricultural land <strong>in</strong> 150 m buffer *<br />
(area of buffer/area of MSU)<br />
• % natural land <strong>in</strong> 150 m buffer * (area<br />
of buffer/area of MSU)<br />
• % natural land <strong>in</strong> 1 km buffer * (area<br />
of buffer/area of MSU)<br />
• Ratio of open water area :<br />
vegetation area
Rapid Method “F<strong>in</strong>al” List cont.<br />
<strong>Marsh</strong> surface elevation<br />
• Elevation to NAVD88<br />
Tidal range/groundwater level<br />
• % of Time <strong>Marsh</strong> Surface Flooded<br />
• Mean Flood Depth (cm)<br />
Sal<strong>in</strong>ity<br />
• Surface water sal<strong>in</strong>ity (@ nekton sites)
Rapid Method “F<strong>in</strong>al” List cont.<br />
Vegetation community<br />
• Species richness us<strong>in</strong>g rapid po<strong>in</strong>t<br />
<strong>in</strong>tercept method on transects<br />
• % Cover Visual Estimations of<br />
– Brackish Terrestrial Border<br />
Community<br />
– Open Water<br />
– Pannes, Pools, & Creeks<br />
– High <strong>Marsh</strong> Community<br />
– Low <strong>Marsh</strong> Community<br />
– <strong>Salt</strong> <strong>Marsh</strong> Terrestrial Border<br />
community<br />
– Upland Community<br />
– Invasive Plant Species
Rapid Method “F<strong>in</strong>al” List cont.<br />
Nekton community<br />
(throw trap, ditch nets)<br />
• Nekton Density<br />
• Nekton Species Richness<br />
• Fundulus heteroclitus length (mm)<br />
Breed<strong>in</strong>g bird community<br />
Po<strong>in</strong>t Count Surveys<br />
• Willet Abundance<br />
• Tidal <strong>Marsh</strong> Obligate Abundance<br />
• Call-broadcast surveys: Clapper Rail,<br />
Willet, <strong>Salt</strong>marsh Sparrow, Seaside<br />
Sparrow
Tidal Regime Influence Diagram<br />
Plant<strong>in</strong>g<br />
Vegetation<br />
Spray<br />
Phrag<br />
<strong>Marsh</strong><br />
Elevation<br />
Flood Duration<br />
(% Time<br />
Flooded )<br />
Sea Level<br />
Rise<br />
Dredge<br />
Spoil<br />
Deposition<br />
Freshwater<br />
Input<br />
Sediment<br />
Traps<br />
Divert<br />
freshwater<br />
Tidal<br />
Exchange<br />
with Bay /<br />
Ocean<br />
Flood Depth<br />
(above marsh<br />
surface)<br />
Tidal<br />
Regime &<br />
Hydrology<br />
Increase<br />
culvert size<br />
Excavate<br />
Channels<br />
Tidal Creek<br />
Density<br />
Sal<strong>in</strong>ity<br />
Goal<br />
<strong>Marsh</strong><br />
Mgmt for<br />
Mosquitoes<br />
Action<br />
Ditch Density<br />
Effect<br />
Measured<br />
Attributes
Alternatives and Consequence Table:<br />
Raw Scores (s ij )<br />
Objectives<br />
Unit Management Action 1 2 3 … 8 9 10<br />
I Current Status 15 200 50 … 0 1 0<br />
I<br />
(A) Excavate old ditch, <strong>in</strong>stall new<br />
culvert under road<br />
19 500 70 … 0 1 0<br />
I (B) Treat Phragmites <strong>in</strong> WUI zone 17 550 65 … 0 1 10<br />
… … …<br />
II (A) DE Bay dredge spoil deposition … …<br />
II<br />
(B) Excavate Old Slaughter Creek<br />
…<br />
…<br />
… … …<br />
III (C) + (D) + (F) … … 0<br />
Slide Courtesy of Jim Lyons
Multi-attribute Utility Theory<br />
utility<br />
Example: Tidal marsh obligate birds<br />
1.00<br />
0.90<br />
0.80<br />
0.70<br />
0.60<br />
0.50<br />
0.40<br />
0.30<br />
0.20<br />
0.10<br />
0.00<br />
0 5 10 15<br />
Score for tidal marsh obligate birds<br />
utility<br />
Example: Nekton density<br />
1.00<br />
0.80<br />
0.60<br />
0.40<br />
0.20<br />
0.00<br />
0.0000 0.0020 0.0040 0.0060 0.0080<br />
Score for Nekton density<br />
Management<br />
Benefit<br />
( ) ∑<br />
10<br />
U Action =<br />
i j =<br />
1<br />
w<br />
Utility functions for illustration purposes only. See spreadsheet for actual utility functions.<br />
Slide Courtesy of Jim Lyons<br />
j<br />
u<br />
ij
Multi-attribute Utility Theory<br />
utility<br />
Example: Tidal marsh obligate birds<br />
1.00<br />
0.90<br />
0.80<br />
0.70<br />
0.60<br />
0.50<br />
0.40<br />
0.30<br />
0.20<br />
0.10<br />
0.00<br />
0 5 10 15<br />
Score for tidal marsh obligate birds (birds / po<strong>in</strong>t)<br />
utility<br />
Example: Nekton density<br />
1.00<br />
0.80<br />
0.60<br />
0.40<br />
0.20<br />
0.00<br />
0.0000 0.0020 0.0040 0.0060 0.0080<br />
Score for Nekton density (# / m^2)<br />
Management<br />
Benefit<br />
( ) ∑<br />
10<br />
U Action =<br />
i j =<br />
1<br />
w<br />
Utility functions for illustration purposes only. See spreadsheet for actual utility functions.<br />
Slide Courtesy of Jim Lyons<br />
j<br />
u<br />
ij
Consequence Table: Utility (u ij )<br />
Objectives<br />
Unit Management Action 1 2 3 … 8 9 10<br />
I Current Status u 1,1 u 1,2 u 1,3 … u 1,8 u 1,9 u 1,10<br />
I<br />
(A) Excavate old ditch, <strong>in</strong>stall new culvert<br />
under road<br />
u 2,1 u 2,2 u 2,3 … u 2,8 u 2,9 u 2,10<br />
I (B) Treat Phragmites <strong>in</strong> WUI zone … …<br />
… … …<br />
II (A) DE Bay dredge spoil deposition … …<br />
II<br />
(B) Excavate Old Slaughter Creek<br />
…<br />
…<br />
… … …<br />
III (C) + (D) + (F) … … u i,j<br />
Slide Courtesy of Jim Lyons
Pareto Efficiency Frontier<br />
8<br />
Conservation Benefit<br />
7<br />
6<br />
5<br />
22<br />
17<br />
16<br />
18<br />
23<br />
13 14<br />
8 9<br />
6<br />
7<br />
24 29<br />
25<br />
34<br />
20<br />
19<br />
15<br />
10<br />
35<br />
4<br />
2<br />
1<br />
Current<br />
Status<br />
3<br />
4<br />
2<br />
0 100 200 300 400 500<br />
Cost over 15 years Slide (x Courtesy $1000) of Jim Lyons
Examples of Data Gathered:<br />
2009 pilot study<br />
Grape Nelson OMWM<br />
Sal<strong>in</strong>ity Mean SD Mean SD Mean SD<br />
Rapid_Sal<strong>in</strong>ity 39 17 nd . 14 1<br />
Vegetation community<br />
Spp Richness 3 4 6<br />
RA_Brack_Terr_Border np . np . np .<br />
RA_Open_Water np . 5 4 np .<br />
RA_Pannes_Pools_Creeks 23 10 8 7 15 17<br />
RA_High_<strong>Marsh</strong> 75 14 69 13 81 13<br />
RA_Low_<strong>Marsh</strong> 31 38 30 13 15 17<br />
RA_<strong>Salt</strong>_<strong>Marsh</strong>_Terr_Border np 6 3 np<br />
RA_Upland np 16 19 np<br />
Invasive species<br />
RA_Invasives np 8 9 3<br />
Nekton community<br />
Spp Richness 5 nd 1<br />
Density 16 1 nd 25 35<br />
Fundulus_Length 40 17 nd 36 16<br />
Breed<strong>in</strong>g bird community<br />
Willet_Abundance 3 4 15 11 15 10<br />
TMO_Abundance 4 3 9 5 12 6<br />
Data from Neckles et al. 2011, draft
2012 Implementation Sites<br />
Moosehorn NWR<br />
Ma<strong>in</strong>e Coastal Island NWR<br />
Rachel Carson NWR<br />
Parker River NWR<br />
RI Complex NWR<br />
Stewart B. McK<strong>in</strong>ney NWR<br />
Long Island Complex NWR<br />
Forsythe NWR<br />
Bombay Hook NWR<br />
Prime Hook NWR<br />
Ch<strong>in</strong>coteague NWR
2012 Data Analysis<br />
• Summary of number of po<strong>in</strong>ts, samples etc.<br />
– 11 National Wildlife Refuges from Ma<strong>in</strong>e to Virg<strong>in</strong>ia<br />
– A m<strong>in</strong>imum of<br />
• 34 salt marsh units<br />
• 680 nekton stations<br />
• 102 bird stations<br />
• 102 vegetation transects and community plots<br />
• 34 water level loggers deployed for at least 1 complete<br />
tidal cycle (spr<strong>in</strong>g and neap tide sequence)
Acknowledgements<br />
Field Crews from 12<br />
National Wildlife Refuges<br />
<strong>in</strong> 2008, 2009, 2012<br />
Project Developers: <strong>USFWS</strong>,<br />
USGS, Univ DE
Questions?