Logging effects on liana diversity and abundance in Central Guyana
Logging effects on liana diversity and abundance in Central Guyana
Logging effects on liana diversity and abundance in Central Guyana
You also want an ePaper? Increase the reach of your titles
YUMPU automatically turns print PDFs into web optimized ePapers that Google loves.
3 RESULTS<br />
Pre-logg<strong>in</strong>g <strong>diversity</strong><br />
3.1 PRE- LOGGING DIVERSITY AND COMPOSITION<br />
3.1.1 Species density <strong>and</strong> <strong>diversity</strong><br />
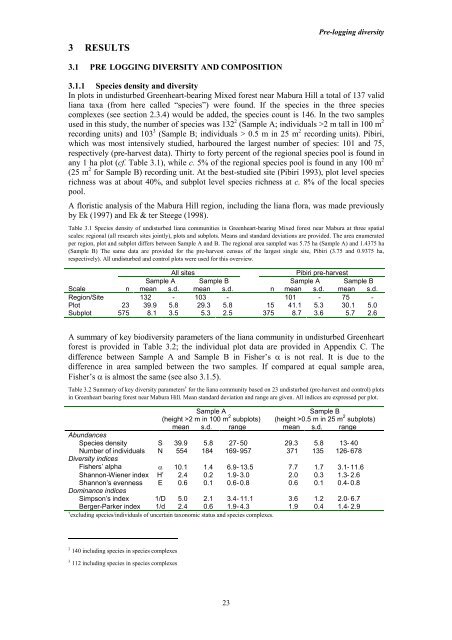
In plots <strong>in</strong> undisturbed Greenheart-bear<strong>in</strong>g Mixed forest near Mabura Hill a total of 137 valid<br />
<strong>liana</strong> taxa (from here called “species”) were found. If the species <strong>in</strong> the three species<br />
complexes (see secti<strong>on</strong> 2.3.4) would be added, the species count is 146. In the two samples<br />
used <strong>in</strong> this study, the number of species was 132 2 (Sample A; <strong>in</strong>dividuals >2 m tall <strong>in</strong> 100 m 2<br />
record<strong>in</strong>g units) <strong>and</strong> 103 3 (Sample B; <strong>in</strong>dividuals > 0.5 m <strong>in</strong> 25 m 2 record<strong>in</strong>g units). Pibiri,<br />
which was most <strong>in</strong>tensively studied, harboured the largest number of species: 101 <strong>and</strong> 75,<br />
respectively (pre-harvest data). Thirty to forty percent of the regi<strong>on</strong>al species pool is found <strong>in</strong><br />
any 1 ha plot (cf. Table 3.1), while c. 5% of the regi<strong>on</strong>al species pool is found <strong>in</strong> any 100 m 2<br />
(25 m 2 for Sample B) record<strong>in</strong>g unit. At the best-studied site (Pibiri 1993), plot level species<br />
richness was at about 40%, <strong>and</strong> subplot level species richness at c. 8% of the local species<br />
pool.<br />
A floristic analysis of the Mabura Hill regi<strong>on</strong>, <strong>in</strong>clud<strong>in</strong>g the <strong>liana</strong> flora, was made previously<br />
by Ek (1997) <strong>and</strong> Ek & ter Steege (1998).<br />
Table 3.1 Species density of undisturbed <strong>liana</strong> communities <strong>in</strong> Greenheart-bear<strong>in</strong>g Mixed forest near Mabura at three spatial<br />
scales: regi<strong>on</strong>al (all research sites jo<strong>in</strong>tly), plots <strong>and</strong> subplots. Means <strong>and</strong> st<strong>and</strong>ard deviati<strong>on</strong>s are provided. The area enumerated<br />
per regi<strong>on</strong>, plot <strong>and</strong> subplot differs between Sample A <strong>and</strong> B. The regi<strong>on</strong>al area sampled was 5.75 ha (Sample A) <strong>and</strong> 1.4375 ha<br />
(Sample B) The same data are provided for the pre-harvest census of the largest s<strong>in</strong>gle site, Pibiri (3.75 <strong>and</strong> 0.9375 ha,<br />
respectively). All undisturbed <strong>and</strong> c<strong>on</strong>trol plots were used for this overview.<br />
All sites<br />
Pibiri pre-harvest<br />
Sample A Sample B Sample A Sample B<br />
Scale n mean s.d. mean s.d. n mean s.d. mean s.d.<br />
Regi<strong>on</strong>/Site 132 - 103 - 101 - 75 -<br />
Plot 23 39.9 5.8 29.3 5.8 15 41.1 5.3 30.1 5.0<br />
Subplot 575 8.1 3.5 5.3 2.5 375 8.7 3.6 5.7 2.6<br />
A summary of key bio<strong>diversity</strong> parameters of the <strong>liana</strong> community <strong>in</strong> undisturbed Greenheart<br />
forest is provided <strong>in</strong> Table 3.2; the <strong>in</strong>dividual plot data are provided <strong>in</strong> Appendix C. The<br />
difference between Sample A <strong>and</strong> Sample B <strong>in</strong> Fisher’s α is not real. It is due to the<br />
difference <strong>in</strong> area sampled between the two samples. If compared at equal sample area,<br />
Fisher’s α is almost the same (see also 3.1.5).<br />
Table 3.2 Summary of key <strong>diversity</strong> parameters † for the <strong>liana</strong> community based <strong>on</strong> 23 undisturbed (pre-harvest <strong>and</strong> c<strong>on</strong>trol) plots<br />
<strong>in</strong> Greenheart bear<strong>in</strong>g forest near Mabura Hill. Mean st<strong>and</strong>ard deviati<strong>on</strong> <strong>and</strong> range are given. All <strong>in</strong>dices are expressed per plot.<br />
Sample A<br />
(height >2 m <strong>in</strong> 100 m 2 subplots)<br />
Sample B<br />
(height >0.5 m <strong>in</strong> 25 m 2 subplots)<br />
mean s.d. range mean s.d. range<br />
Abundances<br />
Species density S 39.9 5.8 27- 50 29.3 5.8 13- 40<br />
Number of <strong>in</strong>dividuals N 554 184 169- 957 371 135 126- 678<br />
Diversity <strong>in</strong>dices<br />
Fishers’ alpha α 10.1 1.4 6.9- 13.5 7.7 1.7 3.1- 11.6<br />
Shann<strong>on</strong>-Wiener <strong>in</strong>dex H’ 2.4 0.2 1.9- 3.0 2.0 0.3 1.3- 2.6<br />
Shann<strong>on</strong>’s evenness E 0.6 0.1 0.6- 0.8 0.6 0.1 0.4- 0.8<br />
Dom<strong>in</strong>ance <strong>in</strong>dices<br />
Simps<strong>on</strong>’s <strong>in</strong>dex 1/D 5.0 2.1 3.4- 11.1 3.6 1.2 2.0- 6.7<br />
Berger-Parker <strong>in</strong>dex 1/d 2.4 0.6 1.9- 4.3 1.9 0.4 1.4- 2.9<br />
† exclud<strong>in</strong>g species/<strong>in</strong>dividuals of uncerta<strong>in</strong> tax<strong>on</strong>omic status <strong>and</strong> species complexes.<br />
2 140 <strong>in</strong>clud<strong>in</strong>g species <strong>in</strong> species complexes<br />
3 112 <strong>in</strong>clud<strong>in</strong>g species <strong>in</strong> species complexes<br />
23


