Logging effects on liana diversity and abundance in Central Guyana
Logging effects on liana diversity and abundance in Central Guyana
Logging effects on liana diversity and abundance in Central Guyana

Create successful ePaper yourself
Turn your PDF publications into a flip-book with our unique Google optimized e-Paper software.
Pre-logg<strong>in</strong>g <strong>diversity</strong><br />
25<br />
20<br />
15<br />
Pibiri, pre-harvest<br />
observed<br />
logseries<br />
S<br />
10<br />
5<br />
0<br />
1 2 4 8 16 32 64 128 256 512 1024 2048 4096<br />
Abundance class, upper boundary<br />
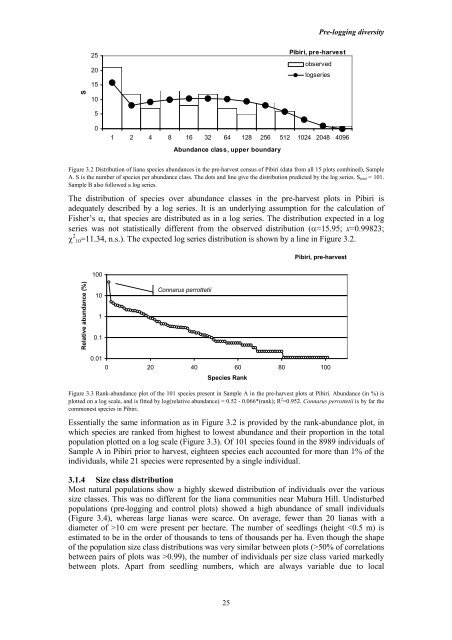
Figure 3.2 Distributi<strong>on</strong> of <strong>liana</strong> species <strong>abundance</strong>s <strong>in</strong> the pre-harvest census of Pibiri (data from all 15 plots comb<strong>in</strong>ed), Sample<br />
A. S is the number of species per <strong>abundance</strong> class. The dots <strong>and</strong> l<strong>in</strong>e give the distributi<strong>on</strong> predicted by the log series. S total = 101.<br />
Sample B also followed a log series.<br />
The distributi<strong>on</strong> of species over <strong>abundance</strong> classes <strong>in</strong> the pre-harvest plots <strong>in</strong> Pibiri is<br />
adequately described by a log series. It is an underly<strong>in</strong>g assumpti<strong>on</strong> for the calculati<strong>on</strong> of<br />
Fisher’s α, that species are distributed as <strong>in</strong> a log series. The distributi<strong>on</strong> expected <strong>in</strong> a log<br />
series was not statistically different from the observed distributi<strong>on</strong> (α=15.95; x=0.99823;<br />
χ 2 10=11.34, n.s.). The expected log series distributi<strong>on</strong> is shown by a l<strong>in</strong>e <strong>in</strong> Figure 3.2.<br />
Pibiri, pre-harvest<br />
100<br />
Relative <strong>abundance</strong> (%)<br />
10<br />
1<br />
0.1<br />
C<strong>on</strong>narus perrottetii<br />
0.01<br />
0 20 40 60 80 100<br />
Species Rank<br />
Figure 3.3 Rank-<strong>abundance</strong> plot of the 101 species present <strong>in</strong> Sample A <strong>in</strong> the pre-harvest plots at Pibiri. Abundance (<strong>in</strong> %) is<br />
plotted <strong>on</strong> a log scale, <strong>and</strong> is fitted by log(relative <strong>abundance</strong>) = 0.52 - 0.066*(rank); R 2 =0.952. C<strong>on</strong>narus perrottetii is by far the<br />
comm<strong>on</strong>est species <strong>in</strong> Pibiri.<br />
Essentially the same <strong>in</strong>formati<strong>on</strong> as <strong>in</strong> Figure 3.2 is provided by the rank-<strong>abundance</strong> plot, <strong>in</strong><br />
which species are ranked from highest to lowest <strong>abundance</strong> <strong>and</strong> their proporti<strong>on</strong> <strong>in</strong> the total<br />
populati<strong>on</strong> plotted <strong>on</strong> a log scale (Figure 3.3). Of 101 species found <strong>in</strong> the 8989 <strong>in</strong>dividuals of<br />
Sample A <strong>in</strong> Pibiri prior to harvest, eighteen species each accounted for more than 1% of the<br />
<strong>in</strong>dividuals, while 21 species were represented by a s<strong>in</strong>gle <strong>in</strong>dividual.<br />
3.1.4 Size class distributi<strong>on</strong><br />
Most natural populati<strong>on</strong>s show a highly skewed distributi<strong>on</strong> of <strong>in</strong>dividuals over the various<br />
size classes. This was no different for the <strong>liana</strong> communities near Mabura Hill. Undisturbed<br />
populati<strong>on</strong>s (pre-logg<strong>in</strong>g <strong>and</strong> c<strong>on</strong>trol plots) showed a high <strong>abundance</strong> of small <strong>in</strong>dividuals<br />
(Figure 3.4), whereas large <strong>liana</strong>s were scarce. On average, fewer than 20 <strong>liana</strong>s with a<br />
diameter of >10 cm were present per hectare. The number of seedl<strong>in</strong>gs (height 50% of correlati<strong>on</strong>s<br />
between pairs of plots was >0.99), the number of <strong>in</strong>dividuals per size class varied markedly<br />
between plots. Apart from seedl<strong>in</strong>g numbers, which are always variable due to local<br />
25