View TurboGen⢠Procedure - Turbine Technologies
View TurboGen⢠Procedure - Turbine Technologies
View TurboGen⢠Procedure - Turbine Technologies

Create successful ePaper yourself
Turn your PDF publications into a flip-book with our unique Google optimized e-Paper software.
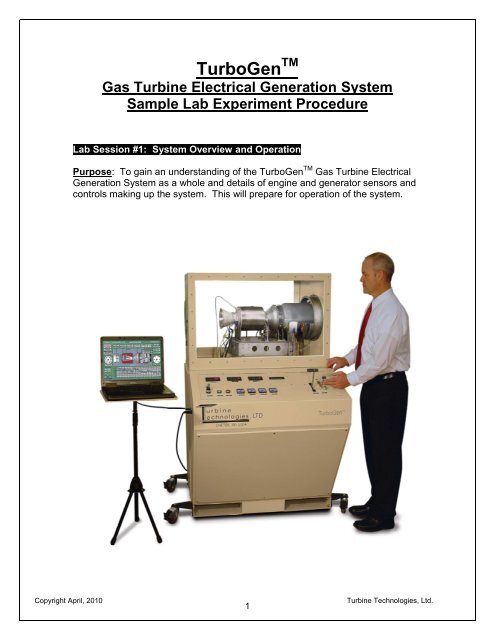
TurboGen TM<br />
Gas <strong>Turbine</strong> Electrical Generation System<br />
Sample Lab Experiment <strong>Procedure</strong><br />
Lab Session #1: System Overview and Operation<br />
Purpose: To gain an understanding of the TurboGen TM Gas <strong>Turbine</strong> Electrical<br />
Generation System as a whole and details of engine and generator sensors and<br />
controls making up the system. This will prepare for operation of the system.<br />
Copyright April, 2010<br />
1<br />
<strong>Turbine</strong> <strong>Technologies</strong>, Ltd.
TurboGen TM is a jet engine powered electrical<br />
generation system.<br />
This type of generation is typically used by the Electrical Power Generation Industry as<br />
supplemental or “peaking” generation. Most electricity is generated by large coal, hydro<br />
or nuclear power plants. These are known as “base load” plants and supply the majority<br />
of electricity needs (typically known as demand). On high demand days (i.e., hot day<br />
with high air conditioning use), the demand can exceed the base load supply<br />
capabilities. When this happens, peaker plants start up to generate enough electricity to<br />
make up for the base generation shortfall. The term “peaker” relates to the electrical<br />
demand curve for the day; if the curve exceeds the base generation abilities, the<br />
peakers are started to supply the “peak”, and are used until demand drops enough<br />
where base supply can handle it.<br />
Demand Exceeds Base<br />
Load Generation Capacity<br />
Electrical Demand<br />
Curve<br />
Gaass Turrbi inee ““Peeaakkeerr””<br />
Stteeaam Turrbi inee<br />
Baassee Loaad Geeneerraatti ion<br />
Copyright April, 2010<br />
2<br />
<strong>Turbine</strong> <strong>Technologies</strong>, Ltd.
How it works!<br />
Engine Air<br />
Intake<br />
Compressor<br />
SR-30 TM<br />
Jet<br />
Engine<br />
Power<br />
<strong>Turbine</strong><br />
Engine<br />
Thrust<br />
Nozzle<br />
Thrust<br />
Transition<br />
Deflector<br />
Electrical Alternator<br />
Free<br />
<strong>Turbine</strong><br />
Load Supply Outlet<br />
Following the cutaway schematic; Air enters the intake of the SR-30 TM Engine. It is<br />
compressed by the centrifugal compressor, mixed with fuel and combusted in the<br />
combustion chamber, creating thrust which drives the power turbine (the power turbine<br />
is connected directly to the compressor and drives it). The thrust then accelerates out<br />
the thrust nozzle. In a straight thrust engine, this would be the propelling force to move<br />
the object the engine is attached to (such as an aircraft). With TurboGen TM , we direct<br />
the thrust through a thrust transition deflector, causing the thrust to drive another turbine<br />
wheel called a free turbine (not mechanically connected to engine, only<br />
thermodynamically connected). The free turbine drives an electrical alternator which<br />
generates electricity to drive an electrical load.<br />
Strategic sensors measure operational conditions of the engine and generation system.<br />
The following shows sensor details (first for engine, then for generator).<br />
Copyright April, 2010<br />
3<br />
<strong>Turbine</strong> <strong>Technologies</strong>, Ltd.
Copyright April, 2010<br />
4<br />
<strong>Turbine</strong> <strong>Technologies</strong>, Ltd.
SR-30 Gas <strong>Turbine</strong> Engine / TG-2000 Electrical Generator<br />
System Sensor Locations<br />
Engine RPM Tachometer Generator: (Displayed on Panel and Data Acquisition Screen as N1<br />
RPM).<br />
P1: Compressor Inlet Pressure (Displayed on Data Acquisition Screen)<br />
T1: Compressor Inlet Temperature (Displayed on Data Acquisition Screen)<br />
P2: Compressor Exit Temperature (Displayed on Data Acquisition Screen)<br />
T2: Compressor Exit Temperature (Displayed on Data Acquisition Screen)<br />
P3: <strong>Turbine</strong>1 Inlet Pressure (Displayed on Panel and Data Acquisition Screen)<br />
T3: <strong>Turbine</strong>1 Inlet Temperature (Displayed on Panel as TIT and Data Acquisition Screen)<br />
P4: <strong>Turbine</strong>1 Exit Pressure/<strong>Turbine</strong>2 Inlet Pressure (Displayed on Data Acquisition Screen)<br />
T4: <strong>Turbine</strong>1 Exit Temperature/<strong>Turbine</strong>2 Inlet Temperature (Displayed on Data Acquisition<br />
Screen)<br />
P5: <strong>Turbine</strong>2 Exit Pressure (Displayed on Data Acquisition Screen)<br />
T5: <strong>Turbine</strong>2 Exit Temperature (Displayed on Panel as EGT and Data Acquisition Screen)<br />
Fuel Pressure: (Displayed on Panel)<br />
Generator RPM Tachometer Generator: (Displayed on Panel and Data Acquisition Screen as<br />
N2 RPM).<br />
Voltage and Current: Displayed on Data Acquisition Screen as Voltage, Current and Power<br />
TurboGen Virtual Instrument Panel<br />
Copyright April, 2010<br />
5<br />
<strong>Turbine</strong> <strong>Technologies</strong>, Ltd.
TurboGen TM Power System Control Panel<br />
7 8 9 6<br />
<strong>Turbine</strong> Inlet<br />
Temperature<br />
Exhaust Gas<br />
Temperature<br />
RPM<br />
Auto Start TM<br />
Engine Status<br />
14<br />
Engine Stop<br />
Button<br />
1<br />
Power<br />
2<br />
Engine<br />
3<br />
Start<br />
10<br />
Oil<br />
11<br />
Fuel<br />
12 13<br />
Key Button Pressure Pressure<br />
Throttle<br />
4<br />
5<br />
Air Pressure<br />
(Air Start)<br />
OPERATIONAL CONTROLS –TurboGen Operator Panel<br />
1. MASTER SWITCH, KEYED: Secured control of access and engine operation<br />
2. GREEN START BUTTON: Automated Engine Start, Multiple Functions<br />
3. RED STOP BUTTON: Immediate EngineStop, Multiple Functions<br />
4. T-HANDLED POWER LEVER: Engine RPM/Thrust Control, Forward Increases<br />
5. LOAD LEVER (Blue Handle): Controls Excitation Loading on Electric Alternator<br />
6. AUTOSTART LCD DISPLAY: Real Time System Status Automatically Shuts Off Unit if<br />
Parameters Exceeded.<br />
DIGITAL and ANALOG OPERATOR DISPLAY: Direct visual indication of<br />
the following:<br />
7. Digital <strong>Turbine</strong> Inlet Temperature (TIT)<br />
8. Digital Engine Rotational Speed (RPM)<br />
9. Digital Generator <strong>Turbine</strong> Rotational Speed (RPM)<br />
10. Analog Oil Pressure<br />
11. Analog Engine Pressure (P3)<br />
12. Analog Fuel Pressure<br />
13. Analog Starting Air Pressure<br />
14. Generator Overspeed Warning Light<br />
Copyright April, 2010<br />
6<br />
<strong>Turbine</strong> <strong>Technologies</strong>, Ltd.
In preparation for system operation and data analysis, please answer the<br />
following questions:<br />
Determine the fuel you are using to power your system. _________________<br />
What is the energy content per unit volume of fuel? __________________<br />
What is the fuel’s density per unit volume? ___________________<br />
Barometric Pressure<br />
Fuel<br />
Pressure<br />
What is the present barometric pressure in your area?<br />
Why would barometric pressure be important when planning to operate the Gas<br />
<strong>Turbine</strong> System?<br />
What will be your reliable source for accurate barometric pressure readings?<br />
System Operation<br />
Purpose: Conduct pre-start, start-up, operation, data gathering and shut down<br />
of TurboGen TM Gas <strong>Turbine</strong> Electrical Generation System.<br />
<strong>Procedure</strong>:<br />
Utilize TurboGen TM Operators Manual and follow Section 4.2 Expanded<br />
Normal <strong>Procedure</strong>s to perform system pre-start, start-up, operation, data<br />
acquisition and shut down.<br />
Utilize the data acquisition system to capture the operational values from startup<br />
to shut down (covered in Section 4.2.3 Data Collection and also covered in<br />
detail on the next page of this sample lab).<br />
Run Engine throttle up to full speed with Load Lever in pinned position<br />
(Fixed Excitation Current).<br />
Optional: After full run-up in pinned position, unpin Load Lever and slowly<br />
bring it forward (increasing Excitation Current) and then slowly pushing it<br />
back (decreasing Excitation Current). A variety of speeds and operating<br />
load condition scenarios can be run during this time.<br />
WARNING!! CHECK OPERATOR’S MANUAL FOR LOAD<br />
LEVER/GENERATOR OVER-SPEED CAUTIONS!<br />
Copyright April, 2010<br />
7<br />
<strong>Turbine</strong> <strong>Technologies</strong>, Ltd.
DATA COLLECTION<br />
Recording and using your data properly is an important part of successfully<br />
completing the lab.<br />
NOTE: The following steps assume the use of the standard TurboGen Software<br />
and default settings as supplied with the TurboGen. Use of non-default setting or<br />
other software may necessitate alternative methods or procedures for data<br />
collection. Consult the Lab<strong>View</strong>/National Instruments<br />
software specific information as required.<br />
From Windows, OPEN the TurboGen Software by doubleclicking<br />
on the TurboGen 1.0 shortcut icon located on the<br />
Windows Desktop. TurboGen 1.0 will start with the Main<br />
Display/Control and Channel Configuration Window<br />
displayed.<br />
NOTE: The computer must be connected to the<br />
TurboGen USB port prior to opening the TurboGen software.<br />
The TurboGen configuration software is dependent upon the specific DAQ<br />
Module serial number as installed in the TurboGen and will not function properly<br />
if the DAQ Module cannot be found. If this was done incorrectly, exit the<br />
program, attach the USB cable and start over.<br />
To verify that the software is communicating with the DAQ<br />
Module, open Measurement and Automation from desktop.<br />
In menu tree, click on Devices and Interfaces, then, click on<br />
NI DAQ 6218. This provides and verifies the proper serial<br />
number for the on board DAQ system and also verifies that a<br />
proper connection to that device is being made.<br />
TO PERFORM THE FOLLOWING FUNCTIONS:<br />
TurboGen Launch Icon<br />
Measurement and Automation<br />
Launch Icon<br />
• Virtual Instrument Panel Software Controls overview are on page 9<br />
• Logging Data to File is shown on Page 10<br />
• Displaying Plot Feature is shown on Page 10<br />
Copyright April, 2010<br />
8<br />
<strong>Turbine</strong> <strong>Technologies</strong>, Ltd.
Copyright April, 2010<br />
9<br />
<strong>Turbine</strong> <strong>Technologies</strong>, Ltd.
Copyright April, 2010<br />
10<br />
<strong>Turbine</strong> <strong>Technologies</strong>, Ltd.
TurboGen TM Gas <strong>Turbine</strong> Electrical Generation System Experiment Manual<br />
Lab Session #2: TurboGen TM Data Run Plots<br />
Purpose: Graphically plot TurboGen TM Run Data in preparation for system<br />
analysis and performance calculations.<br />
<strong>Procedure</strong>: Follow the instructions starting on the following pages of this lab<br />
session to plot system run data.<br />
Plot the following, utilizing MS-Excel Spreadsheet Program:<br />
• Compressor Inlet/Outlet Pressure vs. Time<br />
• Compressor Inlet/Outlet Temperature vs. Time<br />
• <strong>Turbine</strong>1 (N1) Inlet/Outlet Pressure vs. Time<br />
• <strong>Turbine</strong>1 (N1) Inlet/Outlet Temperature vs. Time<br />
• <strong>Turbine</strong> 2 (N2)Inlet/Outlet Pressure vs. Time<br />
• <strong>Turbine</strong> 2 (N2) Inlet/Outlet Temperature vs. Time<br />
• Fuel Flow vs. Time<br />
• Engine RPM vs. Time<br />
• Generator RPM vs. Time<br />
• Generator Voltage vs. Time<br />
• Generator Current vs. Time<br />
• Generator Power vs. Time<br />
Print out plots and order them as listed.<br />
Choose and mark an analysis point on each plot for the same time point.<br />
For this exercise, pick a spot where engine RPM is at or near its peak during the<br />
data run. This will be the basis for system performance analysis calculations.<br />
From your plots (specific time mark) and data collected from system run, please<br />
record the following:<br />
• Date of Run: _____________<br />
• Time: ____________<br />
• Atmospheric Pressure: _________________<br />
• Compressor Inlet Pressure: ____________________________________<br />
• Compressor Exit Pressure: _____________________________________<br />
• <strong>Turbine</strong>1 Inlet Pressure: _______________________________________<br />
• <strong>Turbine</strong>1 Exit Pressure: ________________________________________<br />
• <strong>Turbine</strong>2 Inlet Pressure: _______________________________________<br />
• <strong>Turbine</strong>2 Exit Pressure: ________________________________________<br />
• Fuel Flow: ______________________________<br />
• Engine RPM: _________________<br />
• Compressor Inlet Temperature: _________________________________<br />
• Compressor Exit Temperature: __________________________________<br />
Copyright April, 2010<br />
11<br />
<strong>Turbine</strong> <strong>Technologies</strong>, Ltd.
• <strong>Turbine</strong>1 Inlet Temperature: ____________________________________<br />
• <strong>Turbine</strong>1 Exit Temperature: ____________________________________<br />
• <strong>Turbine</strong>2 Inlet Temperature: ____________________________________<br />
• <strong>Turbine</strong>2 Exit Temperature: ____________________________________<br />
• <strong>Turbine</strong>2 RPM: _______________<br />
• Generator Voltage: _________________<br />
• Generator Current: __________________<br />
Importing Acquisition Data into MS-Excel Spreadsheet<br />
A convenient way to analyze TurboGen performance data is to graph the data<br />
points using MS-Excel Spreadsheet. To do this, the ASCII data captured during<br />
the lab data acquisition must be imported into Excel.<br />
Open: MS-Excel on computer desktop<br />
Click: File<br />
Click: Open<br />
Click: C-Drive<br />
Click: Program Files<br />
Click: TurboGen<br />
Click: “All Files” under “Files of Type”<br />
Click: Next (In Text Import Window, Step 1 of 3)<br />
Click: Next (In Text Import Window, Step 2 of 3)<br />
Click: Next (In Text Import Window, Step 3 of 3)<br />
Your data will now be in spreadsheet form.<br />
Copyright April, 2010<br />
12<br />
<strong>Turbine</strong> <strong>Technologies</strong>, Ltd.
Graphing Data using MS-Excel Spreadsheet Graphing Function (Example)<br />
Highlight columns of data desired for<br />
graph. For this example, the Time<br />
and Voltage column data will be<br />
plotted.<br />
Copyright April, 2010<br />
13<br />
<strong>Turbine</strong> <strong>Technologies</strong>, Ltd.
Insert<br />
Chart Type: Line<br />
Chart Sub Type: Line (first one)<br />
Next<br />
Accept data range listed by<br />
choosing: Next<br />
Choose Graph Options and<br />
Labels<br />
Copyright April, 2010<br />
14<br />
<strong>Turbine</strong> <strong>Technologies</strong>, Ltd.
Name Graph, Click as<br />
New Sheet, Finish<br />
Completed <strong>Turbine</strong> Inlet and<br />
Outlet Pressure Graph<br />
Copyright April, 2010<br />
15<br />
<strong>Turbine</strong> <strong>Technologies</strong>, Ltd.
TurboGen TM Gas <strong>Turbine</strong> Electrical Generation Lab Experiment Manual<br />
Lab Session #3: System Analysis<br />
Purpose: To perform system performance calculations using First Law Energy<br />
Conservation Equation for Steady State, Steady Flow Conditions (SSSF). The<br />
data for these calculations comes from the information plotted and recorded in<br />
the previous lab session<br />
<strong>Procedure</strong>: Perform requested analysis and calculations.<br />
Schematic of Brayton Cycle for Gas <strong>Turbine</strong> and Cut Away of SR-30 Engine<br />
SR-30 Gas <strong>Turbine</strong> Engine<br />
TG-2000 Turbo-Electric Generator<br />
Q add<br />
2 3<br />
Combustion<br />
Q rej<br />
1<br />
Wk Comp<br />
Comp. <strong>Turbine</strong> 1 <strong>Turbine</strong> 2<br />
Q rej<br />
4<br />
5<br />
Wk alternat<br />
Alt.<br />
Power<br />
Output<br />
Copyright April, 2010<br />
16<br />
<strong>Turbine</strong> <strong>Technologies</strong>, Ltd.
For the analysis point chosen in Lab Session #2, find the Specific Enthalpy<br />
at each Cycle Point (using air tables).<br />
H 1 =<br />
h 2 = =<br />
h 3 = =<br />
h 4 =<br />
h 5 =<br />
1.) For the Compression Stage, Find Specific Work Done by the<br />
Compressor (1-2).<br />
2.) For Combustion Stage, Find Specific Energy Added by the Fuel (2-3).<br />
3.) For the <strong>Turbine</strong> Expansion, Find the Specific Work of the <strong>Turbine</strong> (3-4).<br />
4.) Find the Specific Work done by the Cycle .<br />
5. Find the Thermodynamic Efficiency of the Cycle<br />
Copyright April, 2010<br />
17<br />
<strong>Turbine</strong> <strong>Technologies</strong>, Ltd.
TurboGen TM Gas <strong>Turbine</strong> Power System Lab Experiment Manual<br />
Lab Session #4: Engine Performance Analysis<br />
Purpose: To perform system performance calculations of the engine at the<br />
compressor inlet and nozzle exit. The data for these calculations comes from the<br />
information recorded and plotted in a previous lab session<br />
<strong>Procedure</strong>: Perform requested analysis and calculations at this location and<br />
operational point.<br />
COMPRESSOR INLET<br />
Temperature<br />
Probe<br />
Pitot-Static<br />
Tube<br />
What is the Pitot-Static Recorded Pressure (Compressor Inlet Pressure) and<br />
Air Density at this location and operating condition?<br />
Copyright April, 2010<br />
18<br />
<strong>Turbine</strong> <strong>Technologies</strong>, Ltd.
Calculate the gas (air) Velocity into compressor at this operating condition.<br />
Calculate the Volumetric Flow Rate of air into compressor at this operating<br />
condition.<br />
Calculate Mass Flow Rate of air into compressor at this operating condition.<br />
Copyright April, 2010<br />
19<br />
<strong>Turbine</strong> <strong>Technologies</strong>, Ltd.
TurboGen TM Gas <strong>Turbine</strong> Power System Lab Experiment Manual<br />
Lab Session #5: Electrical Generation Performance Analysis<br />
Purpose: To determine optimal operational settings for the SR-30 Gas <strong>Turbine</strong><br />
Engine to calculate Power Specific Fuel Consumption in the process of<br />
generating Electricity.<br />
<strong>Procedure</strong>: Perform requested analysis and calculations that follow.<br />
TurboGen generates electricity by thermodynamically spinning a turbine wheel, which<br />
drives an electric alternator. A basic electric schematic of the electric alternator system<br />
is shown in Figure 1.<br />
The alternator consists<br />
of two basic<br />
components; a rotor and<br />
a stator. The rotor is an<br />
electromagnet (not<br />
permanent), so it needs<br />
Excitation Current for it<br />
to generate electricity.<br />
The rotor spins, creating<br />
a voltage<br />
The rotor consists of a<br />
coil of wire wrapped<br />
around an iron core.<br />
Current through the wire<br />
coil - called "field"<br />
current - produces a<br />
magnetic field around<br />
the core. The strength of<br />
the field current<br />
determines the strength<br />
of the magnetic field. The<br />
Excitation<br />
Current<br />
Stator<br />
Rotor<br />
Stator<br />
Figure 1: Electric Alternator<br />
field current is D/C, or direct current. In other words, the current flows in one direction<br />
only, and is supplied to the wire coil by a set of brushes and slip rings. The magnetic<br />
field produced has, as any magnet, a north and a south pole. The rotor is driven by the<br />
alternator pulley, rotating as the engine runs, hence the name "rotor."<br />
Surrounding the rotor is another set of coils, three in number, called the stator. The<br />
stator is fixed to the shell of the alternator, and does not turn. As the rotor turns within<br />
the stator windings, the magnetic field of the rotor sweeps through the stator windings,<br />
producing an electrical current in the windings. Because of the rotation of the rotor, an<br />
alternating current is produced. As, for example, the north pole of the magnetic field<br />
approaches one of the stator windings, there is little coupling taking place, and a weak<br />
current is produced, As the rotation continues, the magnetic field moves to the center of<br />
N<br />
S<br />
R<br />
Copyright April, 2010<br />
20<br />
<strong>Turbine</strong> <strong>Technologies</strong>, Ltd.
the winding, where maximum coupling takes place, and the induced current is at its<br />
peak. As the rotation continues to the point that the magnetic field is leaving the stator<br />
winding, the induced current is small. By this time, the south pole is approaching the<br />
winding, producing a weak current in the opposite direction. As this continues, the<br />
current produced in each winding plotted against the angle of rotation of the rotor has<br />
the form shown in figure 2. The three stator windings are spaced inside the alternator<br />
120 degrees apart, producing three separate sets, or "phases," of output voltages,<br />
spaced 120 degrees apart, as shown in figure 3.<br />
A Resistive Load “R” completes the circuit as shown in Figure 1.<br />
Copyright April, 2010<br />
21<br />
<strong>Turbine</strong> <strong>Technologies</strong>, Ltd.
Calculating Power Specific Fuel Consumption<br />
Power Specific Fuel Consumption is a measure of fuel consumption of the<br />
engine divided by the electric power produced by the generator.<br />
When the TurboGen was run and data gathered, the optional strategy was to run<br />
the system with the Load Lever pinned (mid-range excitation current) and then<br />
unpin the lever and increase excitation to maximum current, then reduce it to<br />
minimum current. For the following analysis, a data run with all three options is<br />
used (See plotted graphs on pages 25 - 27). It can be seen that a pinned-only<br />
option can still be analyzed.<br />
1. Using your operational run data plots, pull up and print the following graphs:<br />
• N1 RPM (Engine RPM) plotted over Time.<br />
• N2 RPM (Generator RPM) plotted over Time<br />
• Voltage over Time<br />
• Current over Time<br />
• Power over Time<br />
• Fuel Flow over Time<br />
2. Plot analysis points of interest (similar to those shown on graph) for<br />
• Load Lever Pinned<br />
• Load Lever Maximum Excitation<br />
• Load Lever Minimum Excitation<br />
Reasonably exact values can be extracted from your Excel data by lining up a<br />
graphical time stamp with a particular time line in the data.<br />
3. Looking at data values while the excitation current Load Lever was in the<br />
pinned position, pick a specific time marker to view conditions:<br />
Time Marker:<br />
Gas <strong>Turbine</strong> RPM (N1):<br />
Generator <strong>Turbine</strong> RPM (N2):<br />
Speed ratio:<br />
Fuel Flow:<br />
Voltage Output:<br />
Current Output:<br />
Resistance of fixed Resistive Element: R=V/I:<br />
Copyright April, 2010<br />
22<br />
<strong>Turbine</strong> <strong>Technologies</strong>, Ltd.
Power Output = IV:<br />
To hold at this RPM, calculate Power Specific Fuel Consumption:<br />
4. Let’s go to a marker where excitation current Load Lever was loaded to<br />
maximum excitation current:<br />
Time Marker:<br />
Gas <strong>Turbine</strong> RPM (N1):<br />
Generator <strong>Turbine</strong> RPM (N2):<br />
Speed ratio:<br />
Fuel Flow:<br />
Voltage Output = V:<br />
Current Output = I:<br />
Resistance of fixed Resistive Element: R=V/I:<br />
Power Output = IV:<br />
To hold at this RPM, calculate Power Specific Fuel Consumption:<br />
Copyright April, 2010<br />
23<br />
<strong>Turbine</strong> <strong>Technologies</strong>, Ltd.
5. Let’s go to a marker where excitation current Load Lever was loaded to<br />
minimum excitation current:<br />
Time Marker:<br />
Gas <strong>Turbine</strong> RPM (N1):<br />
Generator <strong>Turbine</strong> RPM (N2):<br />
Fuel Flow:<br />
Voltage Output:<br />
Current Output:<br />
Resistance of fixed Resistive Element: R=V/I:<br />
Power Output = IV:<br />
To hold at this RPM, calculate Power Specific Fuel Consumption:<br />
Copyright April, 2010<br />
24<br />
<strong>Turbine</strong> <strong>Technologies</strong>, Ltd.
Copyright April, 2010<br />
25<br />
<strong>Turbine</strong> <strong>Technologies</strong>, Ltd.
Copyright April, 2010<br />
26<br />
<strong>Turbine</strong> <strong>Technologies</strong>, Ltd.
Copyright April, 2010<br />
27<br />
<strong>Turbine</strong> <strong>Technologies</strong>, Ltd.