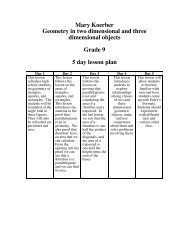
Graphing and Writing Linear Equations (Grade 8) By: Catherine ...
Graphing and Writing Linear Equations (Grade 8) By: Catherine ...
Graphing and Writing Linear Equations (Grade 8) By: Catherine ...

Create successful ePaper yourself
Turn your PDF publications into a flip-book with our unique Google optimized e-Paper software.
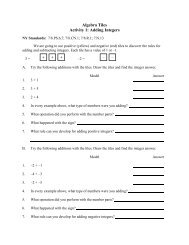
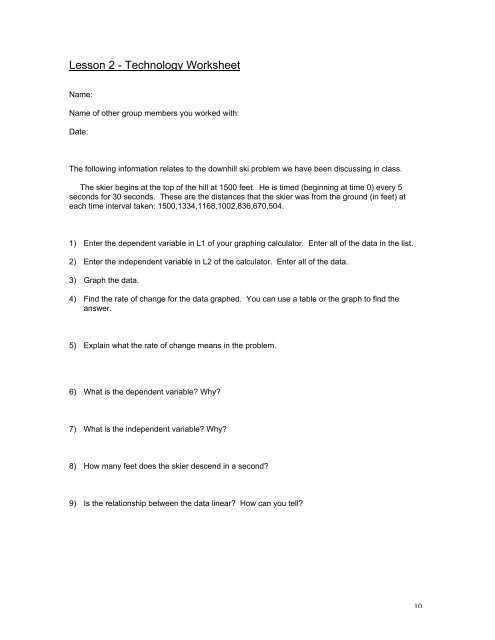
Lesson 2 - Technology Worksheet<br />
Name:<br />
Name of other group members you worked with:<br />
Date:<br />
The following information relates to the downhill ski problem we have been discussing in class.<br />
The skier begins at the top of the hill at 1500 feet. He is timed (beginning at time 0) every 5<br />
seconds for 30 seconds. These are the distances that the skier was from the ground (in feet) at<br />
each time interval taken: 1500,1334,1168,1002,836,670,504.<br />
1) Enter the dependent variable in L1 of your graphing calculator. Enter all of the data in the list.<br />
2) Enter the independent variable in L2 of the calculator. Enter all of the data.<br />
3) Graph the data.<br />
4) Find the rate of change for the data graphed. You can use a table or the graph to find the<br />
answer.<br />
5) Explain what the rate of change means in the problem.<br />
6) What is the dependent variable? Why?<br />
7) What is the independent variable? Why?<br />
8) How many feet does the skier descend in a second?<br />
9) Is the relationship between the data linear? How can you tell?<br />
10