Statewide (PA) Chlorine Contact Time Tracer Study - Gwin, Dobson ...
Statewide (PA) Chlorine Contact Time Tracer Study - Gwin, Dobson ...
Statewide (PA) Chlorine Contact Time Tracer Study - Gwin, Dobson ...

Create successful ePaper yourself
Turn your PDF publications into a flip-book with our unique Google optimized e-Paper software.
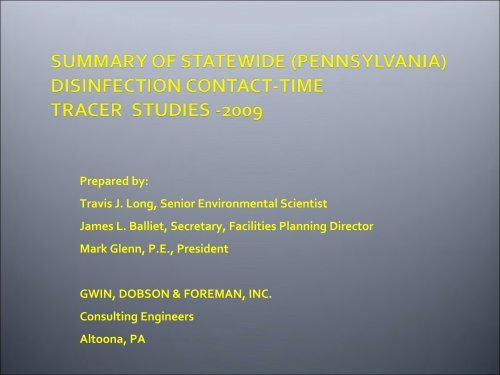
Prepared by:<br />
Travis J. Long, Senior Environmental Scientist<br />
James L. Balliet, Secretary, Facilities Planning Director<br />
Mark Glenn, P.E., President<br />
GWIN, DOBSON & FOREMAN, INC.<br />
Consulting Engineers<br />
Altoona, <strong>PA</strong>
• Ensure disinfection contact time complies with the goals established under<br />
the Interim Enhanced, Long Term 1 and Long Term 2 Surface Water<br />
Treatment Rules and Stage 1 and 2 of the Disinfectants/Disinfection<br />
Byproducts Rule.<br />
• To prepare water suppliers for the “balancing act” of maintaining adequate<br />
pathogen (ex.,giardia) and virus inactivation while avoiding “over<br />
disinfection” that can lead to byproduct formation<br />
• Surface water suppliers may be unaware of the actual short‐circuiting that is<br />
occurring in chlorine contact basins. By default, DEP’s field staff or the water<br />
suppliers had assigned a “rule‐of‐thumb baffling factor” (i.e. short circuiting<br />
estimate) that may not realistically reflect conditions<br />
• Many of the suppliers do not have the technical expertise to conduct tracer<br />
studies, hence <strong>PA</strong>DEP’s efforts to perform studies of select systems.<br />
• This presentation will provide a general overview of tracer studies, selected<br />
methodologies, findings and importance of such efforts to thoroughly<br />
evaluate ones water system
• <strong>Gwin</strong>, <strong>Dobson</strong> & Foreman, Inc was selected to provide statewide tracer<br />
studies in 2005 by the <strong>PA</strong>D Department of Environmental Protection.<br />
• 3‐ year study period (2005‐2008)<br />
• 82 treatment plants were field tested and evaluated for disinfection contact<br />
time along with desk top computations and detailed final reports<br />
• Plants with service area populations of 10–50,000 with capacities ranging<br />
from 1 to 10 mgd.<br />
• More than 140 separate process treatment basins were evaluated to<br />
determine baffling and CT factors<br />
• Basins included contact tanks, clearwells, sedimentation basins, reactor<br />
clarifiers, flocculation units and pipe storage in various geometric shapes,<br />
baffling and inlet/outlet conditions<br />
• For disinfection profiling and actual log‐inactivation, units dedicated for<br />
disinfection (chlorine contact tanks and clearwells) and other unit processes<br />
(sed, floc, filters) were tested analyzed.
• <strong>Tracer</strong> studies are commonly used for reactor mixing characteristics and<br />
actual detention times for treatment processes and unit operations<br />
• A water system must determine the <strong>Contact</strong> <strong>Time</strong> (CT) of each disinfectant<br />
sequence before the first customer to determine the total “inactivation” of<br />
pathogens and viruses.<br />
• <strong>Tracer</strong> studies allow characterization of system dynamics by:<br />
• Demonstrate thoroughness of mixing chambers<br />
• Determine path and time of travel in conduits<br />
• Various methods and materials can be used to achieve evaluation<br />
• Step Input Method<br />
• Pulse Input Method<br />
• Quantifiable Chemical Material<br />
• Dye Material
• <strong>Tracer</strong> studies provide a means of disinfection profiling<br />
• Balancing disinfection and proper inactivation<br />
• Maintaining proper inactivation but limiting disinfection byproducts<br />
• Examine the effects of disinfection practice modifications.<br />
• <strong>Tracer</strong> Studies provide a means of disinfection benchmarking<br />
• Evaluation of significant changes to disinfection practices<br />
▪ Change of points of disinfection<br />
▪ Change to disinfectant used<br />
▪ Change to disinfection process
For the purpose of the study<br />
• identify the type of tracer methodology to be used<br />
• select the tracer chemical that will be introduced at a calculated dosage to<br />
determine the time at which a ten (10) percent rise in concentration of the<br />
tracer from the baseline concentration has occurred.<br />
Once implemented the study will use normalized concentration versus time<br />
profiled to determine the T 10<br />
/ T, which is the detention time required for the<br />
calculation of CT<br />
• <strong>Study</strong> Considerations and Planning<br />
• <strong>Study</strong> Methods
• Determine the desired flow rate or rates<br />
• <strong>Tracer</strong> studies should be performed for at least four (4) different flow rates:<br />
less than average flow; average flow, and two above average flow, with at<br />
least one at 91% of maximum flow ever expected.<br />
• Critical to maintain constant flow rates during study<br />
• Determine process unit volumes or levels to be used<br />
• Critical to maintain constant levels of unit volumes during study<br />
• Identification of accurate injection and sample locations is essential<br />
• Document background concentrations for accurate and precise tracer<br />
evaluation
Effluent Sample<br />
Location<br />
Influent Sample<br />
Location<br />
NaCl Injection
<strong>Contact</strong> Tank<br />
Effluent Sample<br />
Location<br />
NaCl Injection Pt 2<br />
Clarifier/Filter<br />
Influent Sample<br />
Location<br />
Clarifier<br />
&Filter<br />
Effluent<br />
Sample<br />
Location<br />
<strong>Contact</strong><br />
Tank<br />
Influent<br />
Sample<br />
Location<br />
NaCl<br />
Injection<br />
Point 1
Two of the most common methods of tracer addition employed in detention<br />
evaluations are:<br />
• Step Input Method<br />
• Introduction of a tracer chemical at a constant rate until the concentration<br />
at the desired end point reaches a steady state level<br />
• Typically, this method requires feed equipment<br />
• Pulse Input Method<br />
• Introduction of a large instantaneous dose (or pulse) of tracer with samples<br />
taken at the discharge of the unit over time<br />
• This method may not involve feed equipment
• An important step in any tracer study is the selection of a chemical solution to<br />
be used as the tracer.<br />
• The selected tracer should be readily available , that is not adsorbed in the<br />
treatment process, easily monitored, affordable and approved for use in<br />
potable water applications.<br />
• Examples of <strong>Tracer</strong>s:<br />
• Conductivity<br />
• Fluorides<br />
• Chlorides<br />
• Sodium<br />
• Selection and use of a tracer should be discussed and approved by the<br />
regulatory agency prior to use. In addition, public notification may be<br />
required depending upon the tracer selected
• Sodium Chloride (NSF Food Grade Salt) was selected to as the chemical tracer<br />
• Conductivity was the desired tracer indicator<br />
• Rational for selection of Sodium Chloride during statewide study includes<br />
• Readily available and is a conservative tracer since it is not consumed or<br />
removed during the treatment process<br />
• Sodium Chloride is acceptable for use in potable water supplies<br />
• Easily and accurately measured (using portable conductivity meter)<br />
• Was permitted by <strong>PA</strong>DEP<br />
• Sodium Chloride has been successfully demonstrated in over 90 studies state<br />
wide.<br />
• Sufficient background data collection is necessary to assure accurate<br />
evaluation
• <strong>Tracer</strong> Injection :<br />
• Injection rates during the statewide tracer study were set to deliver 50 to<br />
100 mg/L.<br />
• Secondary drinking water standards for total dissolved solids and chloride<br />
are 500 and 250 mg/L respectively<br />
• Injection duration lasted until 10% of the injection concentration break<br />
through was documented (at a minimum), but preferably until 20% break<br />
through was achieved.<br />
• Monitoring<br />
• Grab samples were generally collected every five minutes<br />
• Again, sufficient background sampling is essential to assuring accurate<br />
evaluations
Conductivity meter used in the tracer study analysis. HACH sensION5<br />
conductivity meter, with ±0.5% of range accuracy.
Solution feed tank and variable speed peristaltic feed pump, allowing precise<br />
delivery/dosage of sodium chloride feed solution
• Important <strong>Study</strong> Aspects<br />
• Steady state flow rate<br />
• Constant unit process water level/volume<br />
• Determine unit operations to be tested based on preliminary CT values<br />
• Injection and Monitoring Locations<br />
• Injection locations should simulate the disinfection profile<br />
• Injection locations must allow for adequate dilution and mixing<br />
• Effluent monitoring/sampling at common discharge point of unit<br />
• <strong>Tracer</strong> studies conducted on each section to determine the T 10<br />
for each section.<br />
• To minimize test time and interference with residual tracer material, tracer studies<br />
proceed “upstream” through the units
Example –CT Calculation<br />
• Process Unit<br />
• 194,000 gallon Clearwell (at minimum level)<br />
• Facility Flow Rate<br />
• 4.0 MGD (2,778 gpm)<br />
• Water Quality Conditions<br />
• pH = 7.0<br />
• Temperature = 10 0 C<br />
• <strong>Chlorine</strong> Residual = 0.8 mg/L
• Theoretical Detention <strong>Time</strong> (T) Calculation<br />
• 194,000 gal. ÷ 2,778 gpm = 69.83 minutes<br />
• Assumed Baffling Factor (T 10<br />
/T) = 0.8 or 80 %<br />
• Theoretical Detention <strong>Time</strong> with T 10<br />
/T<br />
• (194,000 gal x 0.8) ÷2,778 gpm = 55.87 minutes
Sample<br />
<strong>Time</strong><br />
Actual<br />
<strong>Time</strong><br />
CONTACT TIME TRACER STUDY<br />
( CLEARWELL)<br />
Sodium Chloride Concentrations (µS/cm)<br />
<strong>Tracer</strong> Solution<br />
Conductivity<br />
C 0<br />
Background<br />
Clearwell<br />
Influent<br />
Clearwell<br />
Effluent<br />
Clearwell<br />
Level:<br />
(Water Level<br />
@ Full)<br />
Background1 10:20 38.2 36.1 194000.0<br />
Background2 10:25 38.1 34.4<br />
Background3 10:30 39.0 33.5<br />
Treatment<br />
Flow Rate<br />
(gpm)<br />
0 HR 00 MIN 10:35 38.43 34.67 194,000.00 2,778<br />
0 HR 10 MIN 10:45 114.5 34.8 194,000.00<br />
0 HR 20 MIN 10:55 157.8 35.3 2,778<br />
0 HR 30 MIN 11:05 159.0 38.4 194,000.00<br />
0 HR 40 MIN 11:15 134.9 54.0 2,778<br />
0 HR 50 MIN 11:25 177.0 72.1 194,000.00<br />
1 HR 00 MIN 11:35 171.0 94.9 2,778<br />
1 HR 10 MIN 11:45 154.3 112.1 194,000.00<br />
1 HR 20 MIN 11:55 137.5 121.8 2,778<br />
1 HR 30 MIN 12:05 148.3 130.1 1940,00.00<br />
Average Clearwell Influent (including tracer): 150.48 uS/cm<br />
Average Clearwell Influent Background: 38.43 uS/cm<br />
Average <strong>Tracer</strong> Conductivity: (150.48-38.43) 112.04 uS/cm<br />
Average Clearwell Background effluent: 34.67 uS/cm<br />
Therefore 10% of C o<br />
= (112.04x0.1) 11.20 uS/cm<br />
Target Concentration for Clearwell Effluent (T 10)<br />
)<br />
= (34.67+11.20) 45.87 uS/cm
• Data from the studies was summarized numerically and graphically<br />
• Graphical analysis was conducted to demonstrate residual concentration versus<br />
time to determine the detention time T 10
• T 10<br />
Calculation for the Clearwell<br />
• Clearwell effluent conductivity + 10% Value of <strong>Tracer</strong> = Target T 10<br />
Value<br />
• Target T 10<br />
value = 34.67 us/cm + 11.20 us/cm = 45.87 us/cm<br />
• Theoretical DT values<br />
• 69.83 minutes<br />
• 55.87 minutes with assumed T 10<br />
• T 10<br />
/T Calculation<br />
• T 10<br />
for the clearwell as derived from the concentration versus time profile =<br />
35 minutes<br />
• T 10<br />
/T = 35 ÷ 69.83 = 0.50<br />
• QA/QC<br />
• 194,000 gal x 0.50 = 97,000 gal ÷2,778 gpm = 34.92<br />
Thus the assumed or historical T 10<br />
/T factor was to liberal and did not give an<br />
accurate representation of the true detention time and contact effective<br />
volume, thereby providing inaccurate log inactivation values.
• During the study the free chlorine residual was 0.8 mg/L, peak hourly flow<br />
rate was maintained at 2,778 gpm and process unit volume remained steady<br />
at 194,000 gallons.<br />
• T 10<br />
/T was calculated to be 0.5, thus proving the effective volume of this<br />
process unit to only be 97,000 gallons.<br />
• With all the variables determined, the CT provided by the facility can be<br />
calculated as follows:<br />
• CT provided by clearwell = (0.8 mg/L)(97,000 gal. ÷2,778 gpm) = 27.93<br />
mg/L‐min of contact time<br />
• CT provided by piping = (0.8 mg/L)(7,050 gal ÷2,778 gpm) = 2.03 mg/L‐min<br />
of contact time<br />
• CT provided by contact tank = (0.8 mg/L)(100,000 ÷2,778 gpm) = 28.80<br />
mg/L‐min of contact time<br />
• Total CT provide by the chlorine disinfection process units = 58.76 mg/Lmin
E<strong>PA</strong> Table E-3 CT Values for Inactivation of Giardia Cysts<br />
by Free <strong>Chlorine</strong><br />
pH = 7.0<br />
<strong>Chlorine</strong> Concentration<br />
(mg/L)<br />
Log Inactivation<br />
0.5 1 1.5 2 2.5 3<br />
• In comparing the calculated CT for the facility and the E<strong>PA</strong> CT values for<br />
inactivation, it is was determined that sufficient CT is being provided under the<br />
tested operating conditions (flow, number of units in operations, basin level)<br />
and water quality conditions (pH, temperature, alkalinity, etc)<br />
• The required CT for 1‐log removal under the stated water quality conditions is<br />
37 mg/L‐minute<br />
• As determined from the study, the total facility CT provided is 58.76 mg/Lminute<br />
• Therefore, the computed Log inactivation value is:<br />
58.76 mg/L‐minute ÷ 37 mg/L‐minute = 1.59<br />
• Please note fluctuation of conductivity measurement during initial stage of<br />
step tracer feed. However, breakthrough (“knee of curve”) is evident and<br />
considered accurate within 1‐2 minutes of contact time and 5‐10% for T10/T
<strong>Chlorine</strong><br />
Residual<br />
(mg/l)<br />
Tabulated<br />
1 log CT<br />
(mg/l-min)<br />
Calculated<br />
1 log CT<br />
(mg/l-min)<br />
2,778 gpm<br />
CT Provided<br />
(@2,778gpm)<br />
Yes / No<br />
Calculated<br />
1 log CT<br />
(mg/l-min) @<br />
2,083gpm<br />
CT Provided<br />
(@2,083 gpm)<br />
Yes / No<br />
Calculated<br />
1 log CT<br />
(mg/l-min)<br />
@1,389gpm<br />
0.1 35 7.35 No 9.80 No 14.69 No<br />
0.2 35 14.69 No 19.59 No 29.38 No<br />
0.3 35 22.04 No 29.39 No 44.07 Yes<br />
0.4 35 29.38 No 39.18 Yes 58.76 Yes<br />
0.6 36 44.07 Yes 58.78 Yes 88.14 Yes<br />
0.8 37 58.76 Yes 78.37 Yes 117.52 Yes<br />
1.0 37 73.45 Yes 97.96 Yes 146.90 Yes<br />
1.2 38 88.14 Yes 117.55 Yes 176.28 Yes<br />
1.4 39 102.83 Yes 137.14 Yes 205.66 Yes<br />
1.6 40 117.52 Yes 156.74 Yes 235.04 Yes<br />
1.8 41 132.21 Yes 176.33 Yes 264.42 Yes<br />
2.0 41 146.90 Yes 195.92 Yes 293.80 Yes<br />
2.2 42 161.59 Yes 215.51 Yes 323.18 Yes<br />
2.4 43 176.28 Yes 235.10 Yes 352.56 Yes<br />
2.6 44 190.97 Yes 254.70 Yes 381.94 Yes<br />
2.8 45 205.66 Yes 274.29 Yes 411.32 Yes<br />
3.0 46 220.35 Yes 293.88 Yes 440.70 Yes<br />
CT Provided<br />
(@1,389gpm)<br />
Yes / No
<strong>Chlorine</strong><br />
Residual<br />
(mg/l)<br />
Tabulated<br />
3 log CT<br />
(mg/l-min)<br />
Calculated<br />
3 log CT<br />
(mg/l-min)<br />
2,778 gpm<br />
CT Provided<br />
(@2,778gpm)<br />
Yes / No<br />
Calculated<br />
3 log CT<br />
(mg/l-min) @<br />
2,083gpm<br />
CT Provided<br />
(@2,083 gpm)<br />
Yes / No<br />
Calculated<br />
3 log CT<br />
(mg/l-min)<br />
@1,389gpm<br />
0.1 104 7.35 No 9.80 No 14.69 No<br />
0.2 104 14.69 No 19.59 No 29.38 No<br />
0.3 104 22.04 No 29.39 No 44.07 No<br />
0.4 104 29.38 No 39.18 No 58.76 No<br />
0.6 107 44.07 No 58.78 No 88.14 No<br />
0.8 110 58.76 No 78.37 No 117.52 Yes<br />
1.0 112 73.45 No 97.96 No 146.90 Yes<br />
1.2 114 88.14 No 117.55 Yes 176.28 Yes<br />
1.4 116 102.83 No 137.14 Yes 205.66 Yes<br />
1.6 119 117.52 No 156.74 Yes 235.04 Yes<br />
1.8 122 132.21 Yes 176.33 Yes 264.42 Yes<br />
2.0 124 146.90 Yes 195.92 Yes 293.80 Yes<br />
2.2 127 161.59 Yes 215.51 Yes 323.18 Yes<br />
2.4 129 176.28 Yes 235.10 Yes 352.56 Yes<br />
2.6 131 190.97 Yes 254.70 Yes 381.94 Yes<br />
2.8 134 205.66 Yes 274.29 Yes 411.32 Yes<br />
3.0 137 220.35 Yes 293.88 Yes 440.70 Yes<br />
CT Provided<br />
(@1,389gpm)<br />
Yes / No
Water Treatment Facility Daily Log<br />
Sample Daily CT Calculation Spreadsheet<br />
Month<br />
CT Point<br />
Free <strong>Chlorine</strong> Residual<br />
Date<br />
Minimum<br />
Clearwell<br />
Volume T 10<br />
/T<br />
Effective<br />
Clearwell<br />
Volume<br />
Maximum<br />
Flow Rate<br />
Detention<br />
<strong>Time</strong><br />
Minimum<br />
Cl 2<br />
Residual<br />
Minimum<br />
CT Value<br />
Tem<br />
p pH min max avg<br />
CT<br />
Required<br />
Log<br />
Inactivation<br />
Provided<br />
Required<br />
Log<br />
Inactivation<br />
Achieved<br />
gal %/100 gal gpm min mg/L<br />
mg/Lmin<br />
ºC S.U. mg/L mg/L mg/L<br />
mg/Lmin<br />
Log<br />
True/Fals<br />
e<br />
1 0.50 0 #DIV/0! #DIV/0! #DIV/0! #DIV/0!<br />
2 0.50 0 #DIV/0! #DIV/0! #DIV/0! #DIV/0!<br />
3 0.50 0 #DIV/0! #DIV/0! #DIV/0! #DIV/0!<br />
4 0.50 0 #DIV/0! #DIV/0! #DIV/0! #DIV/0!<br />
5 0.50 0 #DIV/0! #DIV/0! #DIV/0! #DIV/0!<br />
6 0.50 0 #DIV/0! #DIV/0! #DIV/0! #DIV/0!<br />
7 0.50 0 #DIV/0! #DIV/0! #DIV/0! #DIV/0!<br />
8 0.50 0 #DIV/0! #DIV/0! #DIV/0! #DIV/0!<br />
9 0.50 0 #DIV/0! #DIV/0! #DIV/0! #DIV/0!<br />
10 0.50 0 #DIV/0! #DIV/0! #DIV/0! #DIV/0!<br />
11 0.50 0 #DIV/0! #DIV/0! #DIV/0! #DIV/0!<br />
12 0.50 0 #DIV/0! #DIV/0! #DIV/0! #DIV/0!<br />
13 0.50 0 #DIV/0! #DIV/0! #DIV/0! #DIV/0!<br />
14 0.50 0 #DIV/0! #DIV/0! #DIV/0! #DIV/0!<br />
15 0.50 0 #DIV/0! #DIV/0! #DIV/0! #DIV/0!
• Significant design characteristics include: length‐to‐width ratio, the degree of<br />
baffling within the basin and the effect of inlet baffling and outlet weir<br />
configuration.<br />
• These physical characteristics of the contact basins affect their hydraulic<br />
efficiencies in terms of dead space, plug flow and mixed flow proportions.<br />
• The effectiveness of baffling in achieving a high T 10<br />
/T fraction is more related<br />
to the geometry and baffling of the basin than its function.<br />
• For this reason, T 10<br />
/T may be defined for the levels of baffling conditions<br />
rather than for geometry of the basin.
• The purpose of baffling is to maximize utilization of basin volume, enhance<br />
plug flow conditions within the basin and minimize short circuiting.<br />
• Ideal baffling design reduces inlet and outlet velocities, distributes the water<br />
as uniformly (as practicable) over the entire cross section of the basin,<br />
minimizes “dead spaces” in the basin and prevents short circuiting.<br />
• Categories of baffling conditions were developed to describe basin contact<br />
profiles including:<br />
• Unbaffled<br />
• Poor<br />
• Average<br />
• Superior<br />
• Perfect
Baffling Condition T 10<br />
/T Baffling Description Typical Unit Process<br />
Unbaffled 0.1 None, agitated basins, very low length Clearwell, storage tank, no baffles or perforated inlet or<br />
to width ratio, high inlet and outlet<br />
outlet, submerged inlet and outlets.<br />
flow velocities<br />
Poor 0.3 Single or multiple unbaffled inlets and Conventional sedimentation<br />
outlets, few to none intra basin baffles<br />
basins or clearwell with<br />
2 or 3 baffles<br />
Average 0.5 Baffled inlet or outlet with some intra‐ Some sedimentation basins<br />
basin baffles<br />
with several baffles<br />
Superior 0.7 Perforated inlet baffle, serpentine or Filters or clearwell with perforated intra‐basin baffles,<br />
outlet serpentine baffling<br />
weir or perforated launders<br />
“Perfect” (plug flow) 1.0 Very high length‐to‐width ratio Piping (pipeline flow), perforated inlet, outlet<br />
and intra‐basin baffles
Unbaffled Mixing Conditions (rectangular contact basin with<br />
submerged inlet/outlet)
Poor Baffling Condition (circular contact basin with center<br />
column feed)
Average Baffling Conditions (rectangular contact basin with “overunder”<br />
baffles)
Average Baffling Condition (circular contact basin with center top feed)
Superior Baffling Conditions (rectangular contact basin with serpentine<br />
baffles)
Superior Baffling Condition (circular contact basin with center column<br />
feed and slotted baffle ring)
The following table summarizes the results of the statewide tracer study:<br />
Circular Flocculation Sedimentation Rectangular Pipe<br />
Tanks Basins Basins Clearwells Storage<br />
Over 20 % 15% 35% 40% 0%<br />
Under 50% 55% 47% 41% 0%<br />
Confirms 30% 30% 18% 20% 100%<br />
______________________________________________________ _____<br />
Total No.<br />
of Units 10 38 20 60 10<br />
Note: The “Over” category represents those process units that achieved a higher T 10 /T<br />
that was either assumed or designed for, “Under”represents those process units<br />
that achieved a Lower T 10 /T than was either assumed or designed for, and the<br />
“Confirms” category represents those process units that achieved the same T 10 /T<br />
that was either assumed or designed for.
• Confirmed 29% of the units were designed with the correct baffling factors<br />
• Discovered 27 % of the units had higher baffling factors than originally designed<br />
• Therefore, over half of the units (56%) had baffling factors in excess of design<br />
• Almost half of the units (44%) were tested with baffling factors less than design<br />
• Pipe storage achieves the best degree of baffling, but is not suited for larger plants<br />
• Generally, flocculation/sedimentation tanks have lower baffling efficiency and are<br />
not as effective as dedicated contact tanks and clearwells which have some baffling<br />
• Virtually all plants achieve 1‐log removal while the majority of plants achieve 3‐log<br />
• Many chemical injection locations were not as effective as originally believed
• The <strong>PA</strong>DEP state‐wide tracer study project has proven to be a valuable asset<br />
to system operators by providing data on:<br />
• how the facility disinfection process is actually achieved<br />
• the strengths and weaknesses of system baffling and mixing components<br />
• verification of actual basin volumes and baffling factors<br />
• evaluation of operating levels and monitoring devices<br />
• Facility owners are better equipped for the disinfecting “balancing act”<br />
necessary to comply with LT2ESWTR and DBR.<br />
• Facilities have seen the process and methods necessary to conduct a tracer<br />
study and independently replicate the test process in the future
• <strong>Tracer</strong> studies are a proven and reliable means of evaluating the detention<br />
and contact time through process treatment units<br />
• Can help treatment operators evaluate and monitor disinfection profiling and<br />
achieve the necessary log‐inactivation through varying water quality<br />
conditions<br />
• A means of helping an operator better apply disinfection chemical and reduce<br />
the potential for byproduct formation.<br />
• Can serve as an effective check and balance on process design assumptions<br />
• <strong>Tracer</strong> studies can be easily repeated to evaluate changes in process<br />
treatment systems or unit operation
Questions