AAPI 7th Quarterly Report Apr-June 2012 - AAPI (Accelerating ...
AAPI 7th Quarterly Report Apr-June 2012 - AAPI (Accelerating ...
AAPI 7th Quarterly Report Apr-June 2012 - AAPI (Accelerating ...

Create successful ePaper yourself
Turn your PDF publications into a flip-book with our unique Google optimized e-Paper software.
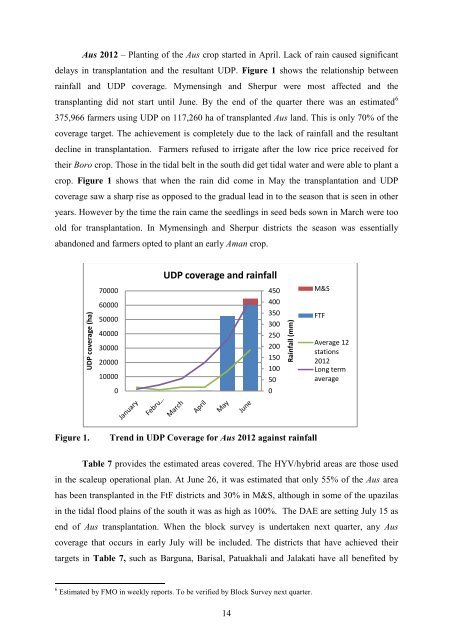
Aus <strong>2012</strong> – Planting of the Aus crop started in <strong>Apr</strong>il. Lack of rain caused significant<br />
delays in transplantation and the resultant UDP. Figure 1 shows the relationship between<br />
rainfall and UDP coverage. Mymensingh and Sherpur were most affected and the<br />
transplanting did not start until <strong>June</strong>. By the end of the quarter there was an estimated 6<br />
375,966 farmers using UDP on 117,260 ha of transplanted Aus land. This is only 70% of the<br />
coverage target. The achievement is completely due to the lack of rainfall and the resultant<br />
decline in transplantation. Farmers refused to irrigate after the low rice price received for<br />
their Boro crop. Those in the tidal belt in the south did get tidal water and were able to plant a<br />
crop. Figure 1 shows that when the rain did come in May the transplantation and UDP<br />
coverage saw a sharp rise as opposed to the gradual lead in to the season that is seen in other<br />
years. However by the time the rain came the seedlings in seed beds sown in March were too<br />
old for transplantation. In Mymensingh and Sherpur districts the season was essentially<br />
abandoned and farmers opted to plant an early Aman crop.<br />
UDP coverage and rainfall<br />
70000<br />
450<br />
M&S<br />
UDP coverage (ha)<br />
60000<br />
50000<br />
40000<br />
30000<br />
20000<br />
10000<br />
400<br />
350<br />
300<br />
250<br />
200<br />
150<br />
100<br />
50<br />
Rainfall (mm)<br />
FTF<br />
Average 12<br />
stations<br />
<strong>2012</strong><br />
Long term<br />
average<br />
0<br />
0<br />
Figure 1.<br />
Trend in UDP Coverage for Aus <strong>2012</strong> against rainfall<br />
Table 7 provides the estimated areas covered. The HYV/hybrid areas are those used<br />
in the scaleup operational plan. At <strong>June</strong> 26, it was estimated that only 55% of the Aus area<br />
has been transplanted in the FtF districts and 30% in M&S, although in some of the upazilas<br />
in the tidal flood plains of the south it was as high as 100%. The DAE are setting July 15 as<br />
end of Aus transplantation. When the block survey is undertaken next quarter, any Aus<br />
coverage that occurs in early July will be included. The districts that have achieved their<br />
targets in Table 7, such as Barguna, Barisal, Patuakhali and Jalakati have all benefited by<br />
6 Estimated by FMO in weekly reports. To be verified by Block Survey next quarter.<br />
14