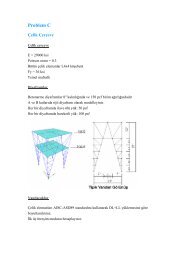
Practical Three Dimensional Nonlinear Static Pushover Analysis
Practical Three Dimensional Nonlinear Static Pushover Analysis
Practical Three Dimensional Nonlinear Static Pushover Analysis

You also want an ePaper? Increase the reach of your titles
YUMPU automatically turns print PDFs into web optimized ePapers that Google loves.
<strong>Practical</strong> <strong>Three</strong> <strong>Dimensional</strong> <strong>Nonlinear</strong> <strong>Static</strong> <strong>Pushover</strong> <strong>Analysis</strong><br />
By Ashraf Habibullah, S.E. 1 , and Stephen Pyle, S.E. 2<br />
(Published in Structure Magazine, Winter, 1998)<br />
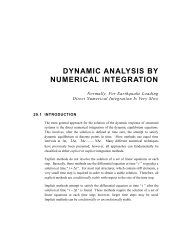
The recent advent of performance<br />
based design has brought the<br />
nonlinear static pushover analysis<br />
procedure to the forefront. <strong>Pushover</strong><br />
analysis is a static, nonlinear<br />
procedure in which the magnitude of<br />
the structural loading is incrementally<br />
increased in accordance with a certain<br />
predefined pattern. With the increase<br />
in the magnitude of the loading, weak<br />
links and failure modes of the<br />
structure are found. The loading is<br />
monotonic with the effects of the<br />
cyclic behavior and load reversals<br />
being estimated by using a modified<br />
monotonic force-deformation criteria<br />
and with damping approximations.<br />
<strong>Static</strong> pushover analysis is an attempt<br />
by the structural engineering<br />
profession to evaluate the real<br />
strength of the structure and it<br />
promises to be a useful and effective<br />
tool for performance based design.<br />
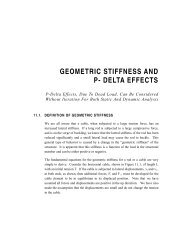
The ATC-40 and FEMA-273<br />
documents have developed modeling<br />
procedures, acceptance criteria and<br />
analysis procedures for pushover<br />
analysis. These documents define<br />
force-deformation criteria for hinges<br />
used in pushover analysis. As shown<br />
in Figure 1, five points labeled A, B,<br />
C, D, and E are used to define the<br />
force deflection behavior of the hinge<br />
and three points labeled IO, LS and<br />
CP are used to define the acceptance<br />
criteria for the hinge. (IO, LS and CP<br />
stand for Immediate Occupancy, Life<br />
Safety and Collapse Prevention<br />
respectively.) The values assigned to<br />
each of these points vary depending<br />
on the type of member as well as<br />
many other parameters defined in the<br />
ATC-40 and FEMA-273 documents.<br />
This article presents the steps used in<br />
performing a pushover analysis of a<br />
simple three-dimensional building.<br />
SAP2000, a state-of-the-art, generalpurpose,<br />
three-dimensional structural<br />
analysis program, is used as a tool for<br />
performing the pushover. The<br />
SAP2000 static pushover analysis<br />
capabilities, which are fully<br />
integrated into the program, allow<br />
quick and easy implementation of the<br />
pushover procedures prescribed in the<br />
ATC-40 and FEMA-273 documents<br />
Force<br />
A<br />
B<br />
IO<br />
LS CP<br />
Deformation<br />
Figure 1: Force-Deformation For<br />
<strong>Pushover</strong> Hinge<br />
for both two and three-dimensional<br />
buildings.<br />
The following steps are included in<br />
the pushover analysis. Steps 1<br />
through 4 discuss creating the<br />
computer model, step 5 runs the<br />
analysis, and steps 6 through 10<br />
review the pushover analysis results.<br />
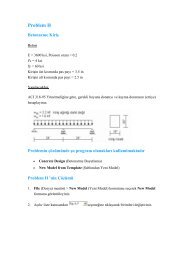
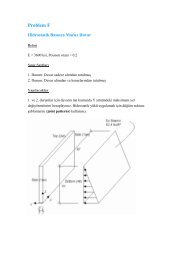
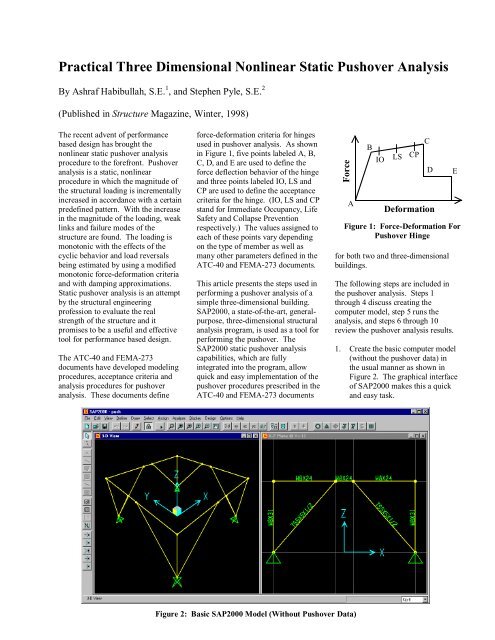
1. Create the basic computer model<br />
(without the pushover data) in<br />
the usual manner as shown in<br />
Figure 2. The graphical interface<br />
of SAP2000 makes this a quick<br />
and easy task.<br />
C<br />
D<br />
E<br />
Figure 2: Basic SAP2000 Model (Without <strong>Pushover</strong> Data)
2. Define properties and acceptance<br />
criteria for the pushover hinges as<br />
shown in Figure 3. The program<br />
includes several built-in default hinge<br />
properties that are based on average<br />
values from ATC-40 for concrete<br />
members and average values from<br />
FEMA-273 for steel members. These<br />
built in properties can be useful for<br />
preliminary analyses, but userdefined<br />
properties are recommended<br />
for final analyses. This example uses<br />
default properties.<br />
3. Locate the pushover hinges on the<br />
model by selecting one or more frame<br />
members and assigning them one or<br />
more hinge properties and hinge<br />
locations as shown in Figure 4.<br />
4. Define the pushover load cases. In<br />
SAP2000 more than one pushover<br />
load case can be run in the same<br />
analysis. Also a pushover load case<br />
can start from the final conditions of<br />
another pushover load case that was<br />
previously run in the same analysis.<br />
Typically the first pushover load case<br />
is used to apply gravity load and then<br />
subsequent lateral pushover load<br />
cases are specified to start from the<br />
final conditions of the gravity<br />
pushover. <strong>Pushover</strong> load cases can<br />
be force controlled, that is, pushed to<br />
a certain defined force level, or they<br />
can be displacement controlled, that<br />
is, pushed to a specified<br />
displacement. Typically a gravity<br />
load pushover is force controlled and<br />
lateral pushovers are displacement<br />
controlled. SAP2000 allows the<br />
distribution of lateral force used in<br />
the pushover to be based on a<br />
uniform acceleration in a specified<br />
direction, a specified mode shape, or<br />
a user-defined static load case. The<br />
dialog box shown in Figure 5 shows<br />
how the displacement controlled<br />
lateral pushover case that is based on<br />
a user-defined static lateral load<br />
pattern (named Push) is defined for<br />
this example.<br />
Figure 3: Frame Hinge Property<br />
Figure 4: Assign <strong>Pushover</strong> Hinges<br />
Figure 5: <strong>Pushover</strong> Load Case Data
5. Run the basic static analysis and,<br />
if desired, dynamic analysis.<br />
Then run the static nonlinear<br />
pushover analysis.<br />
6. Display the pushover curve as<br />
shown in Figure 6. The File<br />
menu shown in this display<br />
window allows you to view and<br />
if desired, print to either a printer<br />
or an ASCII file, a table which<br />
gives the coordinates of each step<br />
of the pushover curve and<br />
summarizes the number of hinges<br />
in each state as defined in Figure<br />
1 (for example, between IO and<br />
LS, or between D and E). This<br />
table is shown in Figure 7.<br />
7. Display the capacity spectrum<br />
curve as shown in Figure 8. Note<br />
that you can interactively modify<br />
the magnitude of the earthquake<br />
and the damping information on<br />
this form and immediately see<br />
the new capacity spectrum plot.<br />
The performance point for a<br />
given set of values is defined by<br />
the intersection of the capacity<br />
curve (green) and the single<br />
demand spectrum curve (yellow).<br />
Also, the file menu in this<br />
display allows you to print the<br />
coordinates of the capacity curve<br />
and the demand curve as well as<br />
other information used to convert<br />
the pushover curve to<br />
Acceleration-Displacement<br />
Response Spectrum format (also<br />
known as ADRS format, see<br />
page 8-12 in ATC-40).<br />
Figure 6: <strong>Pushover</strong> Curve<br />
Figure 7: Tabular Data For <strong>Pushover</strong> Curve<br />
8. Review the pushover displaced<br />
shape and sequence of hinge<br />
formation on a step-by-step basis<br />
as shown in the left-hand side of<br />
Figure 9. The arrows in the<br />
bottom right-hand corner of the<br />
screen allow you to move<br />
through the pushover step-bystep.<br />
Hinges appear when they<br />
yield and are color coded based<br />
on their state (see legend at<br />
bottom of screen).<br />
Figure 8: Capacity Spectrum Curve
9. Review member forces on a stepby-step<br />
basis as shown in the<br />
right-hand side of Figure 9.<br />
Often it is useful to view the<br />
model in two side-by-side<br />
windows with the step-by-step<br />
displaced shape in one window<br />
and the step-by-step member<br />
forces in the other, as shown in<br />
Figure 9. These windows can be<br />
synchronized to the same step,<br />
and can thus greatly enhance the<br />
understanding of the pushover<br />
results.<br />
10. Output for the pushover analysis<br />
can be printed in a tabular form<br />
for the entire model or for<br />
selected elements of the model.<br />
The types of output available in<br />
this form include joint<br />
displacements at each step of the<br />
pushover, frame member forces<br />
at each step of the pushover, and<br />
hinge force, displacement and<br />
state at each step of the pushover.<br />
For buildings that are being<br />
rehabilitated it is easy to investigate<br />
the effect of different strengthening<br />
schemes. The effect of added<br />
damping can be immediately seen on<br />
the capacity spectrum form (step 7,<br />
Figure 8). You can easily stiffen or<br />
strengthen the building by changing<br />
member properties and rerunning the<br />
analysis. Finally you can easily<br />
change the assumed detailing of the<br />
building by modifying the hinge<br />
acceptance criteria (step 2, Figures 1<br />
and 3) and rerunning the analysis.<br />
References<br />
ATC, 1996<br />
Seismic Evaluation and Retrofit of<br />
Concrete Buildings, Volume 1, ATC-<br />
40 Report, Applied Technology<br />
Council, Redwood City, California.<br />
FEMA, 1997<br />
NEHRP Guidelines for the Seismic<br />
Rehabilitation of Buildings,<br />
Developed by the Building Seismic<br />
Safety Council for the Federal<br />
Emergency Management Agency<br />
(Report No. FEMA 273),<br />
Washington, D.C.<br />
Figure 9: Step-By-Step Deformations and Member Forces For <strong>Pushover</strong><br />
1. President, Computers and Structures, Inc., Berkeley, CA.<br />
2. Senior Structural Engineer, Computers and Structures, Inc., Berkeley, CA.