Analysis of Hydrophobic and Hydrophilic Silica TLC Plates ... - dichrom
Analysis of Hydrophobic and Hydrophilic Silica TLC Plates ... - dichrom
Analysis of Hydrophobic and Hydrophilic Silica TLC Plates ... - dichrom
You also want an ePaper? Increase the reach of your titles
YUMPU automatically turns print PDFs into web optimized ePapers that Google loves.
Title: <strong>Analysis</strong> <strong>of</strong> <strong>Hydrophobic</strong> <strong>and</strong> <strong>Hydrophilic</strong> <strong>Silica</strong> <strong>TLC</strong> <strong>Plates</strong> by LAESI-MS<br />
Authors: Trust Razunguzwa, Pamela Williams<br />
PAN00006<br />
Introduction<br />
Thin Layer Chromatography (<strong>TLC</strong>) has been an<br />
indispensable tool to separate complex mixtures in analytical<br />
chemistry since the pioneer studies by Kirchner et al. in the<br />
1950s 1, 2 . <strong>TLC</strong> is convenient, simple, fast, <strong>and</strong> a cost efficient<br />
alternative to LC (liquid chromatography) methods, in which<br />
the latter uses a significantly larger volume <strong>of</strong> solvents. In<br />
addition, multiple samples can be spotted <strong>and</strong> separated<br />
simultaneously on a single <strong>TLC</strong> plate in comparison to<br />
conventional liquid chromatography. Currently, <strong>TLC</strong> remains<br />
an important separation technique <strong>and</strong> there are still <strong>TLC</strong><br />
research applications in food, pharmaceutical, forensic<br />
sciences, clinical, <strong>and</strong> synthetic chemical industries 2, 3 .<br />
Traditionally, <strong>TLC</strong> plates are stained or labeled to provide<br />
information on the retardation factor (R f ) based upon the<br />
position <strong>of</strong> the analyte 3 . Traditional <strong>TLC</strong> staining techniques<br />
do not give a clear identification <strong>of</strong> sample spots; however,<br />
coupled with mass spectrometry (MS), analytes separated<br />
by <strong>TLC</strong> can be identified <strong>and</strong> confirmed with MS/MS<br />
analysis. <strong>TLC</strong> <strong>and</strong> MS have been used in combination for<br />
the past 30 years 2 . The majority <strong>of</strong> the experiments focused<br />
on Matrix Assisted Laser Desorption Ionization Mass<br />
Spectrometry (MALDI-MS) analysis <strong>of</strong> <strong>TLC</strong> plates. MALDI-<br />
MS has a lot <strong>of</strong> instrumental challenges for the direct<br />
analysis <strong>of</strong> <strong>TLC</strong> plates including: 1) Application <strong>of</strong> MALDI<br />
matrix causing spreading <strong>and</strong> elution <strong>of</strong> the sample 2)<br />
MALDI matrix background noise in the low mass range that<br />
can interfere with detection <strong>of</strong> small analytes, 3) specialized<br />
<strong>TLC</strong> plates with a conductive aluminum back are required, 4)<br />
the MALDI UV laser only penetrates the surface <strong>of</strong> the <strong>TLC</strong><br />
plate <strong>and</strong> cannot achieve multiple ablations per location<br />
without application <strong>of</strong> matrix between ablations, 5) MALDI<br />
analysis is carried out in a vacuum chamber 1, 2, 4 .<br />
To overcome some <strong>of</strong> the challenges, there have been<br />
recent advances in atmospheric pressure sample<br />
introduction technologies including DESI (desorption<br />
electrospray ionization). In DESI-MS, a pneumatically<br />
assisted electrospray emitter directly impacts the sample,<br />
which desorbs the analytes into the mass spectrometer. Van<br />
Burkel et al (2005) reported the following DESI-MS<br />
instrumental challenges with <strong>TLC</strong> separation: 1) Physical<br />
damage to <strong>TLC</strong> plate occurs due to mechanical forces <strong>of</strong> the<br />
pneumatic jet, 2) the <strong>TLC</strong> separation must be near plate<br />
edge or excised, 3) frequent maintenance <strong>of</strong> the mass<br />
spectrometer is required to remove <strong>TLC</strong> stationary phase, 4)<br />
the electrospray elutes part <strong>of</strong> the analyte out <strong>of</strong> desorption<br />
the range.<br />
by an electrospray jet prior to detection in the mass<br />
spectrometer. The LAESI-MS technology is a novel<br />
approach in which virtually no sample preparation is needed<br />
prior to analysis 5 . In this report, we utilize LAESI-MS to<br />
image molecules separated on a bare silica <strong>TLC</strong> plate using<br />
the Protea LAESI ® DP-1000 system <strong>and</strong> its proprietary<br />
ProteaPlot imaging s<strong>of</strong>tware. After separation, the <strong>TLC</strong><br />
plates were loaded <strong>and</strong> directly analyzed by LAESI-MS<br />
coupled to a Thermo LTQ XL mass spectrometer.<br />
Experimental<br />
The C 18 reversed phase (RP) <strong>TLC</strong> plates were purchased<br />
from Whatman (Piscataway, NJ). The <strong>TLC</strong> plate size was<br />
2.5 x 7.5 cm with a layer thickness <strong>of</strong> 200 µm, <strong>and</strong> 60 Å<br />
silica bead pore size. The fluorescent hydrophilic plates were<br />
purchased from EMD chemicals (Gibbstown, NJ). For<br />
separation <strong>of</strong> peptides on the RP silica plate, 1 µL <strong>of</strong> a<br />
sample mixture containing three peptides was spotted onto<br />
the <strong>TLC</strong> plate <strong>and</strong> separated using a solution <strong>of</strong> 0.1% TFA in<br />
40% acetonitrile. The peptides ([des-Arg] Bradykinin,<br />
substance P <strong>and</strong> ACTH), were present in at a concentration<br />
<strong>of</strong> 1 µg/µL in solution. Two synthetic compounds, 4-[2-<br />
Methoxy-5-nitro-4-(1-(2,2,2-trifluoroacetamido)ethyl)<br />
phenoxy]-N-[2-(2,2,2,2-trifluoroacetamido)ethyl]butanamide<br />
<strong>and</strong> 4-[2-Methoxy-5-nitro-4-(1-acrylamidoethyl)phenoxy]-N-<br />
(2-acrylamidoethyl)butanamide were spotted <strong>and</strong> separated<br />
on the hydrophilic silica <strong>TLC</strong> plate at 1 µg level for each<br />
compound. These compounds were denoted 1 <strong>and</strong> 2<br />
respectively. Three separation lanes were used on the <strong>TLC</strong><br />
plate, with two <strong>of</strong> the lanes containing one <strong>of</strong> the compounds<br />
<strong>and</strong> the third lane containing a mixture <strong>of</strong> the two<br />
compounds. LAESI-MS was performed on the LAESI DP-<br />
1000 system, using an electrospray voltage 4kV, syringe<br />
flow-rate <strong>of</strong> 2 µL/min, laser energy <strong>of</strong> 700 µJ at 10Hz<br />
repetition rate with 10 pulses at each location. The <strong>TLC</strong><br />
plates were wetted with deionized water after <strong>TLC</strong><br />
separation prior to LAESI-MS to loading onto the LAESI DP-<br />
1000 system.<br />
Laser Ablation Electrospray Ionization Mass Spectrometry<br />
(LAESI-MS) is one <strong>of</strong> the most recent developments in<br />
atmospheric pressure mass spectrometry imaging. In LAESI-<br />
MS, analytes are ablated at ambient pressure by a midinfrared<br />
laser. The ablation plume is intercepted <strong>and</strong> ionized<br />
© 2011 Protea Biosciences, Inc • 877.776.8321 • www.proteabio.com 1
Results<br />
To illustrate the capability <strong>of</strong> LAESI for imaging compounds<br />
separated on <strong>TLC</strong> plates, two plate types, a hydrophobic <strong>and</strong><br />
hydrophilic <strong>TLC</strong> plate were used for LAESI-MS analysis.<br />
Compounds 1 <strong>and</strong> 2 were separated on the hydrophilic <strong>TLC</strong><br />
plate as shown in the schematic <strong>and</strong> fluorescence optical<br />
image in Figure 1A.<br />
[des-‐Arg]-‐Bradykinin<br />
Substance P<br />
m/z = 452.7<br />
m/z = 674.9<br />
A)<br />
245.12 471.16<br />
100<br />
1<br />
100<br />
555.09<br />
2<br />
ACTH (7-‐38)<br />
m/z = 1220<br />
B)<br />
Relative Abundance<br />
1687.96<br />
Relative Abundance<br />
245.06<br />
1085.97<br />
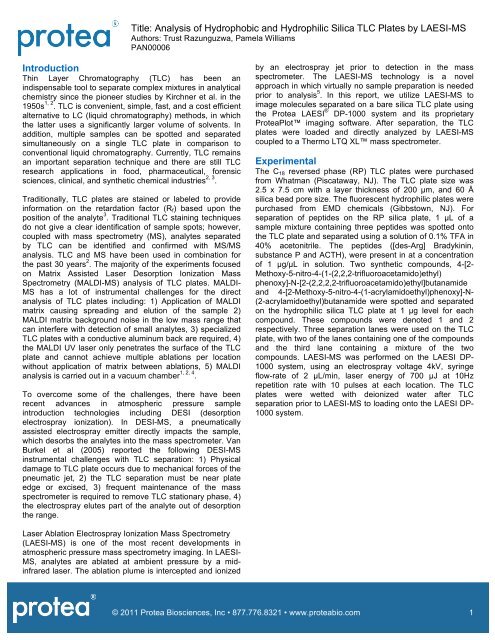
Figure 2: Ion maps <strong>of</strong> peptides (substance P, [des-Arg]-Bradykinin<br />
<strong>and</strong> ACTH (7-38)) separated on a C18 reversed phase silica bead<br />
plate.<br />
C)<br />
0<br />
200 600 1000 1400 1800<br />
m/z<br />
0<br />
200 600 1000 1400 1800<br />
m/z<br />
Conclusion<br />
The Protea LAESI DP-1000 system can be used to analyze<br />
compounds separated on both hydrophilic <strong>and</strong> hydrophobic<br />
<strong>TLC</strong> silica plates, by simply wetting the <strong>TLC</strong> plates with<br />
water. This analytical method can be used to determine both<br />
the location <strong>and</strong> confirm the identity <strong>of</strong> analytes separated on<br />
<strong>TLC</strong> plates.<br />
Figure 1: A) Schematic <strong>of</strong> the separation scheme <strong>of</strong> the two<br />
compounds, <strong>and</strong> a fluorescence optical image <strong>of</strong> separated<br />
compounds 1 <strong>and</strong> 2. B) Resulting mass spectra from LAESI-MS<br />
analysis. C) Ion maps <strong>of</strong> the compounds from ProteaPlot s<strong>of</strong>tware<br />
overlaid on <strong>TLC</strong> images <strong>of</strong> the analyzed <strong>TLC</strong> plate. The<br />
approximate position <strong>of</strong> the compounds optically visualized on the<br />
plate matched the position <strong>of</strong> the compounds indicated by the ion<br />
maps from LAESI-MS analysis.<br />
After performing LAESI-MS analysis on these plates, the<br />
data files were analyzed using ProteaPlot imaging s<strong>of</strong>tware<br />
to determine the location <strong>of</strong> the separated compounds<br />
shown in Figure 1B (sodium adducts at m/z 471.2 <strong>and</strong> m/z<br />
555.1). By overlaying an optical image <strong>of</strong> the <strong>TLC</strong> plate <strong>and</strong><br />
the ion map <strong>of</strong> the compounds from ProteaPlot s<strong>of</strong>tware<br />
(Figure 1C), very good correlation was achieved between<br />
the location <strong>of</strong> the compounds from ProteaPlot ion maps,<br />
<strong>and</strong> the locations indicated by optical fluorescence<br />
visualization (pencil circles). Similarly, an ion map from the<br />
separation <strong>of</strong> peptides on a hydrophobic <strong>TLC</strong> plate was<br />
achieved (Figure 2), showing the locations <strong>of</strong> three<br />
separated peptides, Bradykinin (m/z 452.7), Substance P<br />
(m/z 674.9) <strong>and</strong> ACTH (7-11) (m/z 1220).<br />
References<br />
(1) Han, Y, P. Levkin, I. Abarientos, H. Liu, F. Svec, <strong>and</strong><br />
J.M.J. Fréchet. Monolithic superhydrophobic polymer layer<br />
with photopatterened virtual channel for the separation <strong>of</strong><br />
peptides using two-dimensional thin layer chromatographydesorption<br />
electrospray ionization mass spectrometry.<br />
Analytical Chemistry. 2010, 82, 2520-2528.<br />
(2) Fuchs, B. R. Süß, A. Nimptsch, J. Schiller. MALDI-TOF-<br />
MS directly combined with <strong>TLC</strong>: a review <strong>of</strong> the current state.<br />
Chromatographia Supplement. 2009, 69(1), 95-105.<br />
(3) Robards, K., P.R. Haddad, P.E. Jackson. Principles <strong>and</strong><br />
practice <strong>of</strong> modern chromatographic methods (pp. 44, 182-<br />
224). 1994. San Diego, California: Academic Press.<br />
(4) Van Berkel, G.J., M.J. Ford, <strong>and</strong> M.A. Deibel. Thin-layer<br />
chromatography <strong>and</strong> mass spectrometry coupled using<br />
desorption electrospray ionization. Analytical Chemistry.<br />
2005, 77 (5), 1207-1215.<br />
(5) Nemes, P. <strong>and</strong> A. Vertes. Laser ablation electrospray<br />
ionization for atmospheric pressure, in vivo, <strong>and</strong> imaging<br />
mass spectrometry. Analytical Chemistry. 2007, 79, 8098-<br />
8106.<br />
Acknowledgements<br />
We acknowledge Dr. Miaosheng Li for preparing the<br />
hydrophilic <strong>TLC</strong> plates for analysis.<br />
© 2011 Protea Biosciences, Inc • 877.776.8321 • www.proteabio.com 2


