

1wMF53w
1wMF53w
1wMF53w

You also want an ePaper? Increase the reach of your titles
YUMPU automatically turns print PDFs into web optimized ePapers that Google loves.
CURRENT FRESHWATER USES AND FUTURE SUPPLY - DEMAND MISMATCH<br />
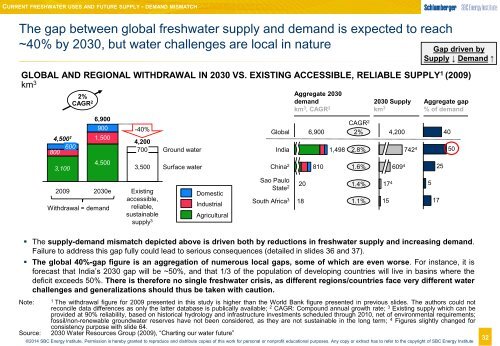
The gap between global freshwater supply and demand is expected to reach<br />
~40% by 2030, but water challenges are local in nature<br />
Gap driven by<br />
Supply ↓ Demand ↑<br />
GLOBAL AND REGIONAL WITHDRAWAL IN 2030 VS. EXISTING ACCESSIBLE, RELIABLE SUPPLY 1 (2009)<br />
km 3 4,500<br />
2%<br />
CAGR 2<br />
6,900<br />
900<br />
4,500 1 1,500<br />
600<br />
800<br />
3,100<br />
-40%<br />
4,200<br />
700<br />
3,500<br />
Ground water<br />
Surface water<br />
Global<br />
India<br />
China 2<br />
Aggregate 2030<br />
demand<br />
km 3 , CAGR 2<br />
CAGR 2<br />
6,900 2% 4,200<br />
810<br />
1,498<br />
2.8%<br />
1.6%<br />
2030 Supply<br />
km 3<br />
609 4 742 4<br />
Aggregate gap<br />
% of demand<br />
25<br />
40<br />
50<br />
2009 2030e<br />
Withdrawal = demand<br />
Existing<br />
accessible,<br />
reliable,<br />
sustainable<br />
supply 3<br />
Domestic<br />
Industrial<br />
Agricultural<br />
Sao Paulo<br />
State 2<br />
South Africa 3<br />
20<br />
1.4%<br />
18 1.1% 15<br />
5<br />
17 4 17<br />
32<br />
• The supply-demand mismatch depicted above is driven both by reductions in freshwater supply and increasing demand.<br />
Failure to address this gap fully could lead to serious consequences (detailed in slides 36 and 37).<br />
• The global 40%-gap figure is an aggregation of numerous local gaps, some of which are even worse. For instance, it is<br />
forecast that India’s 2030 gap will be ~50%, and that 1/3 of the population of developing countries will live in basins where the<br />
deficit exceeds 50%. There is therefore no single freshwater crisis, as different regions/countries face very different water<br />
challenges and generalizations should thus be taken with caution.<br />
Note:<br />
Source:<br />
1<br />
The withdrawal figure for 2009 presented in this study is higher than the World Bank figure presented in previous slides. The authors could not<br />
reconcile data differences as only the latter database is publically available; 2 CAGR: Compound annual growth rate; 3 Existing supply which can be<br />
provided at 90% reliability, based on historical hydrology and infrastructure investments scheduled through 2010, net of environmental requirements;<br />
fossil/non-renewable groundwater reserves have not been considered, as they are not sustainable in the long term; 4 Figures slightly changed for<br />
consistency purpose with slide 64.<br />
2030 Water Resources Group (2009), “Charting our water future”<br />
©2014 SBC Energy Institute. Permission is hereby granted to reproduce and distribute copies of this work for personal or nonprofit educational purposes. Any copy or extract has to refer to the copyright of SBC Energy Institute<br />
32