

1wMF53w
1wMF53w
1wMF53w

You also want an ePaper? Increase the reach of your titles
YUMPU automatically turns print PDFs into web optimized ePapers that Google loves.
VALUE CHAIN AND TECHNOLOGIES<br />
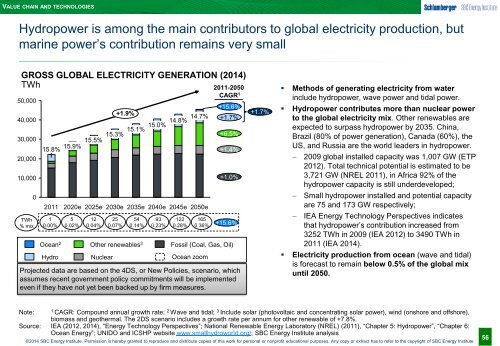
Hydropower is among the main contributors to global electricity production, but<br />
marine power’s contribution remains very small<br />
GROSS GLOBAL ELECTRICITY GENERATION (2014)<br />
TWh<br />
50,000<br />
40,000<br />
30,000<br />
20,000<br />
10,000<br />
0<br />
TWh<br />
% mix<br />
15.8%<br />
2011<br />
1<br />
0.00%<br />
Ocean 2<br />
Hydro<br />
15.9%<br />
2020e<br />
5<br />
0.02%<br />
15.5%<br />
2025e<br />
12<br />
0.04%<br />
15.3%<br />
2030e<br />
+1.9%<br />
15.1%<br />
2035e<br />
Other renewables 3<br />
Nuclear<br />
25<br />
0.07%<br />
54<br />
0.14%<br />
15.0%<br />
2040e<br />
93<br />
0.23%<br />
14.8%<br />
2045e<br />
122<br />
0.28%<br />
14.7%<br />
2050e<br />
165<br />
0.36%<br />
2011-2050<br />
CAGR 1<br />
+15.6%<br />
+1.7%<br />
+6.5%<br />
+1.4%<br />
+1.0%<br />
Fossil (Coal, Gas, Oil)<br />
Ocean zoom<br />
+15.6%<br />
Projected data are based on the 4DS, or New Policies, scenario, which<br />
assumes recent government policy commitments will be implemented<br />
even if they have not yet been backed up by firm measures.<br />
+1.7%<br />
• Methods of generating electricity from water<br />
include hydropower, wave power and tidal power.<br />
• Hydropower contributes more than nuclear power<br />
to the global electricity mix. Other renewables are<br />
expected to surpass hydropower by 2035. China,<br />
Brazil (80% of power generation), Canada (60%), the<br />
US, and Russia are the world leaders in hydropower.<br />
<br />
<br />
<br />
2009 global installed capacity was 1,007 GW (ETP<br />
2012). Total technical potential is estimated to be<br />
3,721 GW (NREL 2011), in Africa 92% of the<br />
hydropower capacity is still underdeveloped;<br />
Small hydropower installed and potential capacity<br />
are 75 and 173 GW respectively;<br />
IEA Energy Technology Perspectives indicates<br />
that hydropower’s contribution increased from<br />
3252 TWh in 2009 (IEA 2012) to 3490 TWh in<br />
2011 (IEA 2014).<br />
• Electricity production from ocean (wave and tidal)<br />
is forecast to remain below 0.5% of the global mix<br />
until 2050.<br />
Note: 1<br />
CAGR: Compound annual growth rate; 2 Wave and tidal; 3 Include solar (photovoltaic and concentrating solar power), wind (onshore and offshore),<br />
biomass and geothermal. The 2DS scenario includes a growth rate per annum for other renewable of +7.8%.<br />
Source: IEA (2012, 2014), “Energy Technology Perspectives”; National Renewable Energy Laboratory (NREL) (2011), “Chapter 5: Hydropower”, “Chapter 6:<br />
Ocean Energy”; UNIDO and ICSHP website www.smallhydroworld.org/; SBC Energy Institute analysis<br />
©2014 SBC Energy Institute. Permission is hereby granted to reproduce and distribute copies of this work for personal or nonprofit educational purposes. Any copy or extract has to refer to the copyright of SBC Energy Institute<br />
56