

1wMF53w
1wMF53w
1wMF53w

You also want an ePaper? Increase the reach of your titles
YUMPU automatically turns print PDFs into web optimized ePapers that Google loves.
CURRENT FRESHWATER USES AND FUTURE SUPPLY - DEMAND MISMATCH<br />
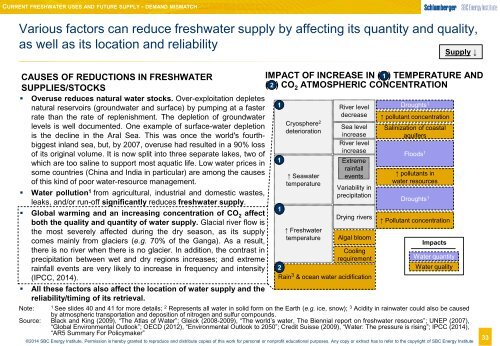
Various factors can reduce freshwater supply by affecting its quantity and quality,<br />
as well as its location and reliability<br />
Supply ↓<br />
CAUSES OF REDUCTIONS IN FRESHWATER<br />
SUPPLIES/STOCKS<br />
• Overuse reduces natural water stocks. Over-exploitation depletes<br />
natural reservoirs (groundwater and surface) by pumping at a faster<br />
rate than the rate of replenishment. The depletion of groundwater<br />
levels is well documented. One example of surface-water depletion<br />
is the decline in the Aral Sea. This was once the world's fourthbiggest<br />
inland sea, but, by 2007, overuse had resulted in a 90% loss<br />
of its original volume. It is now split into three separate lakes, two of<br />
which are too saline to support most aquatic life. Low water prices in<br />
some countries (China and India in particular) are among the causes<br />
of this kind of poor water-resource management.<br />
• Water pollution 1 from agricultural, industrial and domestic wastes,<br />
leaks, and/or run-off significantly reduces freshwater supply.<br />
• Global warming and an increasing concentration of CO 2 affect<br />
both the quality and quantity of water supply. Glacial river flow is<br />
the most severely affected during the dry season, as its supply<br />
comes mainly from glaciers (e.g. 70% of the Ganga). As a result,<br />
there is no river when there is no glacier. In addition, the contrast in<br />
precipitation between wet and dry regions increases; and extreme<br />
rainfall events are very likely to increase in frequency and intensity<br />
(IPCC, 2014).<br />
• All these factors also affect the location of water supply and the<br />
reliability/timing of its retrieval.<br />
IMPACT OF INCREASE IN ( 1 ) TEMPERATURE AND<br />
( 2 ) CO 2 ATMOSPHERIC CONCENTRATION<br />
Cryosphere 2<br />
deterioration<br />
↑ Seawater<br />
temperature<br />
↑ Freshwater<br />
temperature<br />
River level<br />
decrease<br />
Sea level<br />
increase<br />
River level<br />
increase<br />
Extreme<br />
rainfall<br />
events<br />
Variability in<br />
precipitation<br />
Drying rivers<br />
Algal bloom<br />
Cooling<br />
requirement<br />
Rain 3 & ocean water acidification<br />
Droughts 1<br />
↑ pollutant concentration<br />
Salinization of coastal<br />
aquifers<br />
↑ Pollutant concentration<br />
Note: 1<br />
See slides 40 and 41 for more details; 2 Represents all water in solid form on the Earth (e.g. ice, snow); 3 Acidity in rainwater could also be caused<br />
by atmospheric transportation and deposition of nitrogen and sulfur compounds.<br />
Source: Black and King (2009), “The Atlas of Water”; Gleick (2008-2009), “The world’s water, The Biennial report on freshwater resources”; UNEP (2007),<br />
“Global Environmental Outlook”; OECD (2012), “Environmental Outlook to 2050”; Credit Suisse (2009), “Water: The pressure is rising”; IPCC (2014),<br />
“AR5 Summary For Policymaker”<br />
©2014 SBC Energy Institute. Permission is hereby granted to reproduce and distribute copies of this work for personal or nonprofit educational purposes. Any copy or extract has to refer to the copyright of SBC Energy Institute<br />
1<br />
1<br />
1<br />
2<br />
Floods 1<br />
↑ pollutants in<br />
water resources<br />
Droughts 1<br />
Impacts<br />
Water quantity<br />
Water quality<br />
33