Trading Time. - CQG.com
Trading Time. - CQG.com
Trading Time. - CQG.com

You also want an ePaper? Increase the reach of your titles
YUMPU automatically turns print PDFs into web optimized ePapers that Google loves.
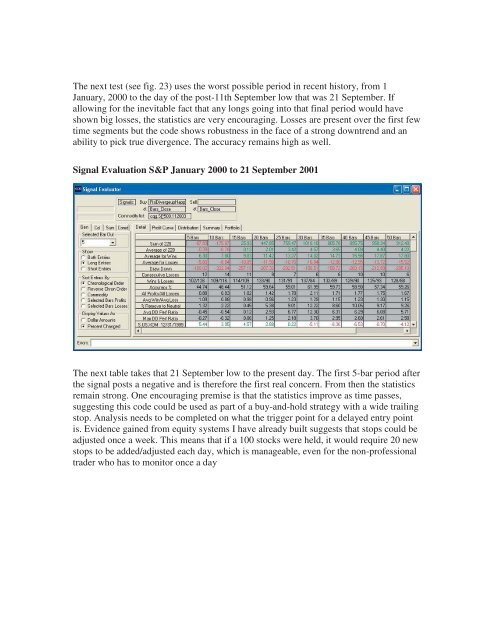
The next test (see fig. 23) uses the worst possible period in recent history, from 1<br />
January, 2000 to the day of the post-11th September low that was 21 September. If<br />
allowing for the inevitable fact that any longs going into that final period would have<br />
shown big losses, the statistics are very encouraging. Losses are present over the first few<br />
time segments but the code shows robustness in the face of a strong downtrend and an<br />
ability to pick true divergence. The accuracy remains high as well.<br />
Signal Evaluation S&P January 2000 to 21 September 2001<br />
The next table takes that 21 September low to the present day. The first 5-bar period after<br />
the signal posts a negative and is therefore the first real concern. From then the statistics<br />
remain strong. One encouraging premise is that the statistics improve as time passes,<br />
suggesting this code could be used as part of a buy-and-hold strategy with a wide trailing<br />
stop. Analysis needs to be <strong>com</strong>pleted on what the trigger point for a delayed entry point<br />
is. Evidence gained from equity systems I have already built suggests that stops could be<br />
adjusted once a week. This means that if a 100 stocks were held, it would require 20 new<br />
stops to be added/adjusted each day, which is manageable, even for the non-professional<br />
trader who has to monitor once a day