Mapping Your Voyage of Discovery - CQG.com
Mapping Your Voyage of Discovery - CQG.com
Mapping Your Voyage of Discovery - CQG.com
- No tags were found...

You also want an ePaper? Increase the reach of your titles
YUMPU automatically turns print PDFs into web optimized ePapers that Google loves.
IntroductionStructure is everything“Without this structure I cannot trade”. This is the reason that the vast majority <strong>of</strong> tradersnever make it past the first year. They have no structure, and eventually the markets simplywear them out.My path through 33 years in the markets reached its nadir in 2004 when I realised that frombeing a trader who couldn’t analyse for the first 10 years, I’d somehow morphed into ananalyst who couldn’t trade. I was scared. The reality is that, as time progresses, naturalability is no longer enough, as it gets blown <strong>of</strong>f course by experience and experiences.As the trader’s powers wane, there is always a boogieman. Today it’s the HFQ’s (HighFrequency Traders). These all conquering automated programmes can trade at the speed <strong>of</strong>light, jump to the front <strong>of</strong> the queue, can cancel a bid or ask after seeing your market order(I’ve no idea how), run all the stops in a blink <strong>of</strong> an eye, and take their pr<strong>of</strong>it before youeven realised you’ve been stopped out.Before that it was the legendary “Flipper”. This was (I think) a mythical character based inSwitzerland who had so much power and money that he could push the Stirs market anywayhe wanted and take out all the scalpers and day traders. I was <strong>of</strong>ten asked whether he was a<strong>CQG</strong> customer. My thought was that the only “Flipper” I knew was a dolphin in a 1960’schildren’s television. That dolphin was damn clever and would knock spots <strong>of</strong>f Skippy theBush Kangaroo and eat Lassie for breakfast, but I doubt he traded Short Sterling.The reality is if you set yourself up to fail, then that’s what you will achieve. Ed Seykota’sexcellent book “The Trading Tribe” has a startling observation on the inside cover.In a nutshell, it confirms that without a clear desire and structure, you will feel that youhave won by losing.The sentence was so pr<strong>of</strong>ound to me I try to remind myself every day that I sit at my desk.For many, the concept <strong>of</strong> the Trading Tribe is a step too far as it involves accepting thefeelings you are unwilling to experience. They're rational to get around this problem is toremove themselves from the process <strong>of</strong> trading altogether. That or embarking on an endlessvoyage <strong>of</strong> creating fully automated systems. It seems that the adage, “If you can’t beatthem, then join them” has never been more poignant. I’m <strong>of</strong>ten asked why I don’t usetrading systems. To me this insinuates that if I know as much as I’m supposed to regarding
Technical Analysis I must have hundreds <strong>of</strong> systems or methods. Well I used to, but now Ionly have one, and it’s a grey box. Part <strong>of</strong> what I do is automatic and has fixed rules, but Iretain an element <strong>of</strong> discretion. This revolves primarily around volume and the correcttimeframe to reference, whilst covering a broad spectrum <strong>of</strong> markets, so that I am aware forwhat is the easiest trade. With so many years <strong>of</strong> experience it is impossible for me to throwthat all away in favour <strong>of</strong> mathematics.My own voyage <strong>of</strong> discovery reached an impasse in 2004. I had be<strong>com</strong>e the ultimateCandlestick pattern. I knew so much I had the answer to everything and a solution tonothing. I wasn’t losing, but I wasn’t making either. The frustration became unbearable. Myown solution was to do the Van Tharp home study course. It took a month, but therevelations it revealed were invaluable. My problem was that money and power were notan important motivation. This was hardly surprising as my wife had a serious road accident 5years previously. Everyone knows that health is far more important than money. From 1999to 2002 she had no fewer than 5 major operations on her neck and spine, was foreverhaving scans and seeing consultants, living in constant pain. Even now whenever I have tosay “Hospital” I <strong>com</strong>e out with”Hotel”. Rest assured, the Burj al Arab is cheaper per nightthan a hospital bed. I had to find the money to pay effectively for months at the Burj. I havenever traded so spectacularly in all my life. To be fair, I was fortunate that 2000 to 2001 sawsome major trends, but the truth is, I was so focused I would have made money whateverthe conditions. That focus had been there when trading was my job. Trade badly and I’d beout <strong>of</strong> one and that was all the motivation I needed. Once that need had gone so did mytrading ability.One <strong>of</strong> the established golden rules <strong>of</strong> trading is that you shouldn’t trade if you aredesperate to make money. My problem was the opposite. I only made money when Idesperately needed it. The rest <strong>of</strong> the time it was simply an Intellectual game. The secondproblem was also the opposite <strong>of</strong> what most caused traders to lose. Whereas a trader’schange <strong>of</strong> perspective in life and getting older and wiser creates responsibilities to othersand a burden, I regarded being responsible for others as an inspiration.Never being a person who does things by half’s I threw myself into Van Tharp’spsychological voyage <strong>of</strong> discovery through meditation and chanting. My wife would<strong>com</strong>ment to my daughters (who found it hilarious) “yes, your father is a lunatic”, after I’djust bellowed “I’m a great trader” and made them all jump out <strong>of</strong> their skin.Out <strong>of</strong> this, my initial solution was to throw away at least 90% <strong>of</strong> what I knew about tradingand Technical Analysis (having concluded what was the important 10% for me). The secondconclusion was to write my first book that crystallised that 10%, and to supplement that bywriting daily and weekly technical <strong>com</strong>mentaries. If someone were paying me to write, itdidn’t matter where I was in the world, or how busy I was, I was obligated to do it. I hadcreated a disciplined structure. Throughout the 6 years I did this, it soon became apparentthat actually, I was writing the <strong>com</strong>mentaries for my own benefit. One subscriber would
have been enough. Through time, I began directly teaching and mentoring traders on aconsultancy basis, and I then realised that when I mentored, I traded better myself. Iabandoned the <strong>com</strong>mentaries as I had found a new disciplined structure that had created apersonal connection that increased my sense <strong>of</strong> responsibility. Over time, it honed downmy skills to a relatively simple process that meant I could analyse any market in less than aminute. This is defined as follows:• True measures <strong>of</strong> support and resistance• True measures <strong>of</strong> Overbought and Oversold• True measurement <strong>of</strong> the Daily charts behaviour• How is the crowd positioned?• The correct timeframe chart to reference intraday• The time <strong>of</strong> the day it is• Risk and Expectation• The correct volume to execute• Relative performance between markets and asset classes• Buy the strongest, Sell the weakest• If time permits, Micro Analysis <strong>of</strong> the Depth <strong>of</strong> Market and volume• Position management and movement through timeframes if a trade develops• Chart <strong>of</strong> the day and week• What is the easiest trade?This may seem a huge amount to achieve in a minute, but with structure, and its consistentapplication it is possible. It also means that I look for an opportunity across over 90 markets,and don’t try and force a trade or make a market bend to my will. I don’t care what thename at the top <strong>of</strong> the chart says, and it has reached the point that, without this structure, Icannot trade.I want you to think about that last sentence. “Without this structure I cannot trade”.This is the reason that the vast majority <strong>of</strong> traders never make it past 5 years. They have nostructure, and eventually the markets simply wear them out.
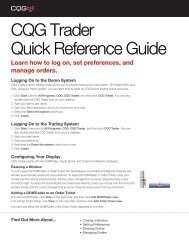
PrefaceWho is this book for?In contrast to my previous book, which was <strong>com</strong>plex, and a heavy read, this book is aimed ata more general audience. Whilst it assumes a rudimentary knowledge <strong>of</strong> markets, it issuitable for beginners who wish to have a starting point and template to trade. It also issuitable to those who have hit a roadblock in their trading and wish to see a freshperspective. Finally, for the experienced trader there is insight and food for thought, placingideas in a new light about how they may look at technical analysis. To a larger degree I haveused examples that were as up to date as possible, <strong>of</strong>ten from just a few days previously.The book was written over a six-week period <strong>of</strong> May and June 2012 and then September2012. There are natural spaces within the book so that for the most part you do not have toturn a page in order to reference a chart to the text.How can I help you once you have read the book?Unfortunately, books by nature are inanimate objects, but I have included all the settingsand variables <strong>of</strong> the studies. Some aspects <strong>of</strong> the book (largely at the beginning and end)refer to s<strong>of</strong>tware or studies that are only available in <strong>CQG</strong> and I have shown exactly hownavigate the relevant parts <strong>of</strong> the s<strong>of</strong>tware. They <strong>of</strong>fer trials <strong>of</strong> their s<strong>of</strong>tware so you cancross-reference in real-time. I can be contacted at shaun.downey@btinternet.<strong>com</strong> andshaun.downey2@btinternet.<strong>com</strong> , and I am more than happy to help with anysupplementary questions you have. For those who wish to go on a deeper journey I alsomentor and coach full time since I left <strong>CQG</strong>.
Part 1Basic Chart TypesConstant volume barsConstant Volume bars have many advantages over traditional chart types, in that they builddata based on activity. This can be either set as the number <strong>of</strong> trades (ticks), or an absolutevolume setting. I prefer the latter. The problem with Tick based volume is the everincreasingnumber <strong>of</strong> ticks from HFT’s (high frequency trading). This means that thegoalposts continue to shift. The principle advantage <strong>of</strong> volume-based bars is that many <strong>of</strong>the traditional momentum indicators are skewed on normal timeframe based charts byperiods <strong>of</strong> relative inactivity, or the extended hours that most markets are now open. Thismeans that momentum tends to flat line and requires a structured approach to etherredefine data, or have a method for adjusting to the correct timeframe chart for youranalysis. Most traders do this instinctively. However, it is equally important to have amethod for what volume setting you should use. Here, is the method I employ.Taking the E-mini as an example, I first <strong>com</strong>pute what my typical risk is via Volatility TimeBands, as they <strong>com</strong>pute risk based on the time <strong>of</strong> the day it actually is. I know fromexperience that it is usually around four big figures. However, you can use a 1 periodAverage True Range. Adjust your chart timeframe until that figure is 20% above what youview as acceptable risk. In my case, this means an Average True Range <strong>of</strong> five big figures.The 10-minute chart shows that five is <strong>of</strong>ten a limit <strong>of</strong> range with occasional spikes oneconomic numbers.
Next, place the volume study on the chart and modify it so it is showing the bid / askvolume. This also tells you whether buyers or sellers are in charge or if there are spikes inactivity.Take the normalised volume that misses the opening and closing and gauge where thenormal limits <strong>of</strong> volume are. On this market, it is typically between twenty and twenty fivethousand.This is now the volume range that you can use on the Constant Volume chart. The differencebetween that and a 10 minute chart may initially seems superficial, but analysis <strong>of</strong> the in thenumber <strong>of</strong> bars built in a day is considerable, with nearly twice as many Constant VolumeBars in the original pit hours. The morning session will build less and help preventmomentum flat lining.
The 10-minute chart and the 25,000 Constant Volume
Advanced Chart TypesMarket Pr<strong>of</strong>ileMarket pr<strong>of</strong>ile remains the most popular enablement that traders subscribe to, and is usefulas a crowd following tool, if you understand the basic patterns and theories. These arecovered in Chapter 2 <strong>of</strong> my previous book.The understandings in what are true measures <strong>of</strong> support and resistance cannot beunderestimated.The basis <strong>of</strong> successful trading is all about timing. Therefore, knowing when price is atsupport and resistance (basis Pr<strong>of</strong>ile)is a key building block. All your other momentumanalysis or tools <strong>of</strong> choice should be framed around where support and resistance is.This study originated in the grain pits at the CBOT in the early 1980s. Peter Steidlmayer, anexchange local, found that for much <strong>of</strong> the time price simply ebbed and flowed with the pittraders. He noted that it was orders <strong>com</strong>ing into the pit that dictated when price trended.He came to the conclusion that he needed to find a way to distinguish between the short,medium, and long-term trader, and thus Market Pr<strong>of</strong>ile® was born.Market Pr<strong>of</strong>ile® remains my first port <strong>of</strong> call, whatever asset class or instrument I’m trading.The theories now extend to methods <strong>of</strong> scalping, day trading, structured plays, providingtargets, placement <strong>of</strong> stops, the strength <strong>of</strong> the trend and optimum points for wherecorrections should begin and trends should end. Once the structure has been understood,the trader can switch their focus to the other studies used in their technical framework. Itcan <strong>of</strong>ten be the case that, by the time the main strategic trade concludes, the short-termtrades working the core position have made more than if the actual strategic position weresimply left alone from entry to eventual exit. Understanding the short-term bias when it’s inthe opposite direction to the core trade allows the overall entry point to change to a moreadvantageous position. For the aggressive, it can highlight moments when the existing coretrade can be pyramid for a day trade, via Market Pr<strong>of</strong>ile® or you existing methodologies.Whilst the ability, to shift between short and long-term focus requires practice, disciplineand skill, once mastered it provides the structure to manage positions.Linking price, time and volumeMarket Pr<strong>of</strong>ile® has a unique property which helps us to understand price action. It linksprice, time, and volume. No other study does this so concisely and in one picture. The vastmajority <strong>of</strong> existing analysis concentrates on the bar or candle pattern or the level <strong>of</strong> amomentum indicator based on the closing price. Volume has been the most neglectedaspect <strong>of</strong> all and attempts to create meaningful studies have been thwarted, simply becausethere are so many internal factors that distort the actual volume. The beauty <strong>of</strong> Market
Pr<strong>of</strong>ile® is that linking price, time and volume provides a clearer picture <strong>of</strong> the state <strong>of</strong> themarket. This can then be used to quantify the traditional methods <strong>of</strong> patterns andmomentum and place them in a context <strong>of</strong> the importance.The first concept to understand is:Price + Time = Market AcceptanceEvery time a market trades there is a buyer and a seller. They have made a bargain andexchanged contracts. At the time <strong>of</strong> the trade, it is impossible to know the circumstances <strong>of</strong>the transaction, but the aftermath can be analysed and conclusions drawn.This leads us to:Market Acceptance = VolumeEvery time there is a trade the volume associated with market acceptance potentiallyprovides clues to the future direction, although at the moment that it occurs, it <strong>of</strong>tenprovides little insight. It is only the subsequent price movement that dictates interpretation.That is unless the volume can be linked to other indicators, allowing immediate conclusionsto be drawn. This is a key <strong>com</strong>ponent in analysing the market, and is the reason that from aMarket Pr<strong>of</strong>ile® standpoint, there is no such thing as overbought or oversold. From a MarketPr<strong>of</strong>ile® perspective, we only know that the price displayed that characteristic afterwards.With no concept <strong>of</strong> overbought and oversold until after it has been proven, this leads us tothe final building block in theory.Volume = Market (fair) valueEvery time price trades it is fair. This is an important psychological aid. A key <strong>com</strong>ponent toMarket Pr<strong>of</strong>ile® is that it is long-term players who dictate and end trends.There are two established theories about how the end is formed:1. When trending upwards sellers suddenly match buyers in high volume and preventfurther progress.2. There is no volume as there is simply no one left to buy, as the final capitulation <strong>of</strong> losingshorts has <strong>com</strong>pleted its painful exit. At that point, the supply side strengthens, demanddrops, and price reverses swiftly back to a point where buyers and sellers feel value is fair,and volume goes back up. The reality is that from a Market Pr<strong>of</strong>ile® standpoint, bothreasons are valid. Therefore, while it’s impossible to know whether a high or low is beingmade at that instant, once a reaction has occurred, any subsequent move back to that areais highly significant. This re-enforces the theory that we have no idea <strong>of</strong> the importance <strong>of</strong>any trade at any price, unless we can link it to previous price action or other types <strong>of</strong>analysis. Chart types such as TFlow and its associated volume and depth-based studies areuseful in qualifying such times.
Types <strong>of</strong> activityThe behaviour <strong>of</strong> long-term players is split into two areas:1. Initiative activityLong-term players dictate trends and when the volume they wish to trade cannot besatisfied at one price, their perception <strong>of</strong> fair value shifts, and price trends.2. Responsive activityLong-term traders dictate the end <strong>of</strong> the trend by withdrawing initiative activity, takingpr<strong>of</strong>its, or establishing countertrend positions. They also dictate when the reaction to atrend has been <strong>com</strong>pleted. Long-term traders are <strong>of</strong>ten identified by a single letter printwithin a day. These single prints start trends and end them at extremes and at rejections <strong>of</strong>value.The Market Pr<strong>of</strong>ile® display
Basic philosophiesIt is primarily used as a day trading tool for the vast majority <strong>of</strong> participantsHowever, for the experienced user, it can be used for all time horizons and has particularuse in managing strategic positions, and subsequent day trading within that core view. This<strong>of</strong>ten involves the merging <strong>of</strong> more than one day’s activity in order to gain a clearerunderstanding <strong>of</strong> support and resistance.Often it is possible to eliminate one side <strong>of</strong> the marketThis is a huge plus when day trading, as it <strong>of</strong>ten dictates which side you can play from andremoves one third <strong>of</strong> the problem. Buy, sell, or do nothing. For example, the market has abullish set up, so I can only buy, and then sell partial amounts, before looking to re-establishthe entire long position.Initial Analysis goes back five daysThis is because the short-term trader can’t remember more than five days back. In fact,<strong>of</strong>ten the long-term trader can’t either. Can you remember the open/high/low/close in amarket you traded eight days ago? The reference <strong>of</strong> the past five days <strong>of</strong>ten provides veryprecise support and resistance levels, and it highlights correct levels for the placement <strong>of</strong>stops and pr<strong>of</strong>it taking opportunities.Manipulation and MergingPr<strong>of</strong>iles can be merged by holding down your left mouse in the scale at the bottom <strong>of</strong> thechart and dragging to the left. It will allow you to merge one day at a time. Whilst thes<strong>of</strong>tware defaults to 30-minute timeframe for each letter, it is possible to build a pr<strong>of</strong>ile onany timeframe.Type : ,5cThis will produce six letters per 30-minute period and provides a greater degree <strong>of</strong> clarity <strong>of</strong>market movements.This concept can be taken the other way to build much larger timeframe pr<strong>of</strong>iles, mergedays and then bring it back to the default.Type : ,DCOn a futures market, this will now produce a daily continuation. Each letter now representsa day’s range. There are three ways that data can be merged.
On this setting, the study will simply show the fixed Value Area High and Low, plus theControl Point based on the last data point, or for the close <strong>of</strong> previous days. They can beused for support and resistance.TPO Pr<strong>of</strong>ile and Volume are defaulted not to show, but is an extremely useful indication <strong>of</strong>both volume based supports and resistances and in creating a link between time (TPO’s) andactual volume. It also usually provides an area <strong>of</strong> support and resistance that reflects thehigh volume point and the Control Point.Making the change to Dynamic mode shifts how the Value Area and Control are visualised.Normally it will default to using 5-minute data and will show how these references changedthroughout the trading day. This is extremely useful in understanding the dynamic <strong>of</strong> trenddays, as the trend is confirmed by Value moving with that trend. Dynamic conditions canalso be built in the Formula Toolbox, which is useful in over<strong>com</strong>ing the fact that the studycan look somewhat confusing.
TFlow and Pre Trade AnalyticsTFlow is a chart type unique to <strong>CQG</strong>. Developed and tested In-house, its primary aim is toredefine data and create graphical ways <strong>of</strong> interpreting bias in the way that bids are hit or<strong>of</strong>fers are taken. PreTrade Analytics was developed to <strong>com</strong>plement TFlow and provide ways<strong>of</strong> interpreting the Depth <strong>of</strong> Market either side <strong>of</strong> the current Bid / Ask. I spent a month in2007 recording sessions <strong>of</strong> data in order to gain an understanding <strong>of</strong> some if its dynamicsand how this can be used to help analysis and trade location.What is TFlow?Launched via the Add Chart button, the Set Up window can be accessed by right clicking ona TFlow bar or via the Set Up button, Chart Preferences and the Main Tab.TFlow is split into three charts types.BarsThese are created, based on the Aggregation Level and represent a change in the Bid or Ask.An aggregation level <strong>of</strong> 13 means that one bar will be built and <strong>com</strong>pleted once there havebeen thirteen changes. The maximum aggregation allowed is twenty. The bars are colouredin two ways.The amount that was traded by hitting the bid and the amount that traded by taking theask. This relationship is shown by default as red (hitting the bid) and green (taking the ask).The brightness and width <strong>of</strong> the bars is dictated by the amount <strong>of</strong> volume that was traded.This Vol Threshold has four different outputs.
Percent <strong>of</strong> Average values represent percents <strong>of</strong> average volume. It is calculated as thearithmetic mean <strong>of</strong> total volume <strong>of</strong> all bars in the same session from the previous tradingday.Percent <strong>of</strong> Rank indicates where the bar falls relative to look back period.If the previous day's average is not available, then actual volume values will be displayed.No Normalization changes the bar colour to black and removes weighted volume. Range <strong>of</strong>the bid and ask is displayed.Volume Threshold (TFlow Vol): This chooses how the bars should look relative to volume.For example, if the percentage <strong>of</strong> volume is greater than 90, then the bid bar is bright redand asks is bright green. If the actual volume is greater than 10, but less than 50, the bid baris dark red and the ask is dark green.In my analysis, I kept the Vol Threshold type as the default, set the Aggregation at 13 anddisplayed the Volume study underneath the TFlow chart. If no volume appears, modify itand select Bid Ask. The Vol Threshold here is different to TFlow. Any number set abovezero, will show, within the histogram <strong>of</strong> volume, if there are any big chunks <strong>of</strong> volume.
This is how my TFlow is first displayed. It is on the E-Mini and has the volume threshold setat 1000.
RangeAs the name suggests, these are built based on range. Traditional TFlow bars can beintensive to watch for extended periods and as the speed <strong>of</strong> High Frequency Tradingescalates, it has be<strong>com</strong>e a greater issue. Range bars slow the speed <strong>of</strong> activity down andhave advantages in the analysis <strong>of</strong> both volume and absolute movement. This has particularapplication on the fastest markets such as the Dax and Crude Oil. However, there are alsoadvantages in markets that are more sedate, but are also distorted by HFT’s, such as 10 yearNotes and Bobl’s. The maximum aggregation is also 20, which represents 20 ticks. Whensetting the range to be used, I use the same calculation as utilised on Constant VolumeBars. This is based on risk, so the E- Mini uses a maximum range <strong>of</strong> 16 ticks or 4 big figures.This can only be reduced, not widened.
SmoothedSmoothed use a proprietary algorithm that attempts to remove noise without losingsensitivity. This is achieved by tracking the trend and redefining the highs and lows basedon what the trend is. This means that the high and low can be synthetic. This removessome <strong>of</strong> the noise that can be associated with traditional TFlow bars and gives a clearerpicture <strong>of</strong> what the trend is. This is highlighted below, by overlaying normal TFlow with aSmoothed. Whilst the former has bars that show higher highs and lows and potentialconflict with the trend, the Smoothed maintains lows that are equal or lower than the barbefore. Eventually, making a higher low signals a trend ending.
Pre-Trade AnalyticsPre-Trade Analytics is a group <strong>of</strong> studies tracking the actions by traders in the exchange’sorder book. These studies measure the orders above and below the current bid / ask beingplaced or canceled by traders as the TFlow bar builds.They are split into four studiesDOMTrackerDOMTracker OscillatorDOMActivityOlder Orders RatioI am going to concentrate on DOMTracker as it provides the best insight.DOMTrackerThe DOMTracker study plots two lines: a weighted sum <strong>of</strong> the <strong>of</strong>fers (red line) and theweighted sum <strong>of</strong> the bids (green line).DOMTracker theoryKey points to remember• In a downtrend, we expect the bid volume (green line) to be above the ask volume• In an uptrend, we expect the ask volume (red line) to be above the bid• Increases in one side or the other in a sideways market indicate that a trend isdue.• Collapses in the trend volume indicate exhaustion• Crossovers between lines show that the market has finished the trendThe next chart is <strong>of</strong> the E-Mini and highlights how the DOMTracker can be used to tracktrends and signal when the trend is over. Due to the fact that it uses an average that is thesame as your aggregation (thirteen), it is prudent to wait for that number to build in the Pitsession. The study falls in value ahead <strong>of</strong> the economic release, and the volume is low in theminute after it <strong>com</strong>es out. The TFlow bars then pick up volume and the DOMTrackerconfirms the trend as the red line is above the green. Note how the Volume study below theDOMTracker has a premature exit. At the highs, the DOMTracker switches direction andrides the trend back down (green above red) until the close <strong>of</strong> business.
This example highlights once more how DOMTracker outperforms the volume study. Thereis one premature exit, but the low is only shortly before the next crossover. It then does afar better job <strong>of</strong> tracking the uptrend that develops into the close.
Entry Signal EvaluatorWhy it is an essential tool in your education and understanding <strong>of</strong> Technical AnalysisIt is difficult for me to explain fully, how important and useful this tool is without soundingsomewhat evangelical. Both new and experienced traders normally embark on a voyage <strong>of</strong>discovery, dictated by what they have either read (normally Murphy’s guide to technicalanalysis), seminars they have attended, or exams they have taken. Whilst the <strong>of</strong>ficialcourses run by Technical Analysis societies around the globe are useful in providing abackdrop and framework to traditional methods, they are essentially reference guides. Inmany ways, the core values <strong>of</strong> Technical Analysis and what is perceived to be important anduseful to the trader haven’t changed in thirty years. Do you think that the markets haven’tchanged in thirty years? Of course, they have, and in recent years dramatically so.It is prudent and wise to take any established mantra or any technical idea you have and dothree things.1. Test its basic accuracy2. Visualise data and the study’s outputs3. Decide whether this fits in with your event horizon (how long does a trade last)and the type <strong>of</strong> trader you think you can be a success at.This process is time consuming, but that’s all it costs you: TIME. Blindly accepting theestablished clichés and mantra’s and applying this to real money is usually a ruinousprocess. The markets and the methods you employ that have not been fully understood willlead to the result that markets and the methods employed can remain irrational far longerthan you can remain solvent. Either that, or you abandon the method and start the voyage<strong>of</strong> discovery once more, without having any idea that the sequence <strong>of</strong> losses where entirelywithin the normal variation <strong>of</strong> what that method was.
What does Entry Signal Evaluator do?Entry Signal Evaluator takes any technically based conditions and plots their performanceagainst one market or a portfolio up to sixty bars after the entry point. There is no moneymanagement, so in effect, it is giving you a best and worst case scenario. (You wouldn’t beable to exit at the perfect point, and you wouldn’t hold a losing position forever). Thismeasurement <strong>of</strong> raw performance provides a quick and easy to visualise analysis <strong>of</strong> whetheryour original idea has any statistical bias.How do you use it?It has a wizard that will guide through the process, which is accessed by hitting the NEWbutton.It asks you to select a Portfolio. This can be from a predefined one, or you can click onSelect , and it will show the Portfolio menu, from which you can create your own. You onlyneed to stipulate the contract without the month, and you can also use the Question Markfeature to access back months.
Part 2Crowd following Techniques.It is critical to understand and be aware <strong>of</strong> what is popular.It is <strong>of</strong>ten said <strong>of</strong> political circles, that if you repeat a lie or mantra <strong>of</strong>ten enough, eventuallythe public will believe it. For humans, perception is everything and first impressions count.We subconsciously collate and make assumptions almost immediately after we areintroduced to new information, whether it is forming opinions on people or almost anythingfor that matter. It is no accident that subliminal advertising is banned. Trading and TechnicalAnalysis is a world drowning in assumptions and mantras, many <strong>of</strong> them contradictory orsimply incorrect. To both the beginner and the struggling pr<strong>of</strong>essional, it can soon feel likewhat I call Cloud Driving. I once found myself, riding a motorbike in clouds, on the hellishmountain roads <strong>of</strong> Sicily. Navigating in fog at night is bad enough, but navigating in cloudsat night, means it’s foggy, its chucking it down with rain, your head is up in the air, and youreyes are closed.It is essential that you are aware <strong>of</strong> both crowd following techniques and employ a healthyscepticism towards lazy clichés.
Momentum IndicatorsThe vast majority <strong>of</strong> technical based indicators analyse momentum in a multitude <strong>of</strong> ways.Whilst it makes sense to have a measurement <strong>of</strong> momentum, how many ways do you needto visualise the same thing? I <strong>of</strong>ten see traders with three or four indicators plottingmomentum and sometimes many more than this. They are then placed on manytimeframes, which can lead to conflicting information as momentum rarely synchs up. Themore timeframes you look at the greater the conflict is likely to be. This can lead to paralysiswhen you have no position or emotional decision-making when you have. There will bemany times when one timeframes momentum is down, and another is up. Unless you havea structure for understanding what is the dominant timeframe in relationship to yourtrading objectives (how long does a trade last) and concept <strong>of</strong> risk and volume, then the<strong>com</strong>mon behaviour is to simply fish around different timeframe charts and indicators untilone tells you what you already wanted it to. This random procedure is fine for the greattrader, but ruinous for the rest <strong>of</strong> us. Chapter three <strong>of</strong> my previous book creates a structurefor understanding what the dominant timeframe is and I grade each bar via my RangeDeviation Pivots. I then use Market Pr<strong>of</strong>ile to confirm what the trend is and where thesupports and resistances are. However, in the absence <strong>of</strong> using those methods, there arealso some simple rules that you can follow.1. What is the trend on the daily chart?If day trading or having a very short trade time horizon, it is easy to forget what the biggerpicture actually is. I always reference the daily chart and look at the previous day’srelationship <strong>of</strong> the open/high/low/close. Without placing any momentum indicators on thechart at all, I simply visualise what the trend is. It’s usually obvious, and I connect that withthe previous day’s pattern.- Was it confirming the trend?- Was it a reversal against the trend?- Was it a neutral day?
2. What is the Average True Range on the chart you are analysing?For me, risk and its relationship to volume is one the critical relationships that have to beplaced in a consistent framework. A key element in achieving this is to clarify the timeframechart and the Average True Range that it is currently displaying. A <strong>com</strong>mon mistake is toreference an intraday chart that has a range that is far higher than your concept <strong>of</strong> risk interms <strong>of</strong> ticks. Picture yourself as a trend follower. <strong>Your</strong> predefined risk on any trade isnever more than ten ticks, but you are analysing <strong>of</strong>f a 60-minute chart that has a range <strong>of</strong>fifty ticks. At what point can you truly clarify that your trade is wrong based on a bar thatcan move five times more than risk?When visiting traders, one <strong>of</strong> the first questions I ask them, are what timeframe charts doyou use? The answer is always a variation <strong>of</strong> “oh I use a thirty, sixty, plus the daily andsometimes go down to the five or two minute”. No one has ever said, “I use the timeframechart that fits with my concept <strong>of</strong> risk and volatility”. If you do this, then you have created afluid framework that rides the waves <strong>of</strong> volatility in a consistent manner, and provides astructure for which your momentum indicators <strong>of</strong> choice can be utilised. The basic rules areas follows.- If the Average True Range is below your concept <strong>of</strong> risk in ticks then the timeframechart is too low, and the information is irrelevant.- If the Average True Range is more than double your concept <strong>of</strong> risk, in terms <strong>of</strong>ticks then the timeframe chart is too high.To put this in some sort <strong>of</strong> context, during the craziness <strong>of</strong> 2011, there were times when thetimeframe I was referencing on crude oil was down to a one-minute chart. In contrast,during the moribund period in early 2012, this had risen to a ten minutes at its lowest, androse to as high as a sixty minute.
Slow StochasticsSlow Stochastics represent the most popular study in the technical universe and theestablished mantras represent a critical threat to your wellbeing. Designed by George Lane,they take the relationship between the high and low to the close (K line). Then a smoothingis added to create the (D) line. The default setting is shown below. It is rare to see trader’sgoing beyond changing the variable <strong>of</strong> 14. A typical change is to 10.This connection between the close and the extreme <strong>of</strong> the bar means that if thisrelationship shifts against the dominant trend the effect on the study is disproportionate.This is exasperated if the studies value is near its limit <strong>of</strong> range, which can oscillate betweenzero and one hundred. It is the clearest example <strong>of</strong> the problems <strong>of</strong> putting a linearcalculation and a data set that is non- linear.However, once the studies characteristics are understood, it is possible to build strategiesaround it and more importantly, take advantage <strong>of</strong> the ill-informed. It’s a cold fact that ifyou are to make money consistently, you’re going to have to take it <strong>of</strong>f someone who losesconsistently.There are two basic interpretations:• The market is overbought when above 80 and oversold below 20.• Signals are taken when the lines cross in these zones or have crossed and thenmove out <strong>of</strong> the extreme zones.• Additional use is as a divergence indicator. The market makes a new high, but theStochastic fails to breach its previous high and crosses down. This is also referredto as a Failure Swing. Execution can <strong>com</strong>e either when the lines cross or <strong>com</strong>e out<strong>of</strong> the extremes.
And with those interpretations <strong>com</strong>es many misconceptions:• The crossover theory in pr<strong>of</strong>itable.Tests reveal that a crossover in an extreme zone is at best random and worst ruinous. Thepower <strong>of</strong> Stochastics lies in the data you are going to apply it to, or the revised strategy youare going to employ. Stochastics are far better suited in their original interpretation onmarkets that are mean reverting. This applies to spreads or pairs trading on stocks that areusually correlated. There are also some primary markets that are also prone to meanreversion. Dollar Canada (Looney) is one that a standard crossover from overbought oroversold will have more relevance. The chart below is a half-day one with the crossoversmarked.
This chart is half day <strong>of</strong> the Eurodollar twelve-month calendar spread.Signal Evaluation tests reveal the extent <strong>of</strong> the problem on primary markets. Whilst thestock portfolio does show a small pr<strong>of</strong>it eventually, the accuracy hovers just below 50%. Thefutures and FX portfolio are worse with large losses and accuracy in the low 40’s. In fact, it’ssufficiently poor that work can be done on taking advantage <strong>of</strong> this, which we will gothrough later in this section.
Average Directional Movement Index and Trade SystemsWith adjustments to the basic study, it is possible to use the ADX as a filter to identifysideways trends. The logic is very simple. I use a much longer-period ADX than the standarddefault <strong>of</strong> ten, so that the indicator is smoothed out. Typically, a value <strong>of</strong> between thirty andfifty will have the desired effect. If the value <strong>of</strong> the ADX has fallen for at least two bars, thenthat signifies a sideways trend. From there, it is possible to use another method for pullingthe trigger on a trade. The Slow Stochastic typically works best in sideways, and whentrading spreads, so a short variable setting such as a five, three, and three, will havesufficient sensitivity whenever it crosses up or down. You can add that this must happenfrom the overbought or oversold zone. Here, is the code without that added criteria.ADX(@,34) < ADX(@,34)[-1] AND ADX(@,34)[-1] < ADX(@,34)[-2] AND SSK(@,5,Smo,3)XABOVE SSD(@,5,Smo,3,Smo,3)The sensitivity <strong>of</strong> the Stochastic at this setting means that it acts as a stop loss if it crossesback in the opposite direction <strong>of</strong> the entry. The statistics and pr<strong>of</strong>itability <strong>of</strong> such a systemwill not stand up in its own right, but it be<strong>com</strong>es useful as a <strong>com</strong>plement to existing trendfollowingsystems. When they lose, the sideways system will normally win, and this helpssmooth out your equity curve and drawdown duration. The chart below shows an example.
Trend Lines and FibonacciThe need to create a framework around where your draw trend lines and what significanceyou place on them is a crucial part <strong>of</strong> your trading armoury. Even with the rules that I amgoing to give you, I personally only draw trend lines on historical data. There are manyreasons for doing this, such as the pitfalls set out below.• It is easy to get attached to trend lines and start drawing support and resistancelines based on what you want to happen, or more dangerously, to justify yourcurrent position.• Trend lines represent the maximum point in uncertainty. Will the line hold or fail?• Just because you think a trend line is important does not mean the market does.• If you find yourself redrawing lines that are shallower in angle you are probablyemotionally attached to your position and losing money, or have a pre-definedview <strong>of</strong> where the market should go.Therefore, to avoid these mistakes it is necessary to create some rules so that good habitsare established.• Begin with drawing lines on Daily’s and Weekly’s only.• Trend lines have little value on charts below 30 minutes.• Trend lines can only be broken on a closing basis, and you can wait for a two barclose if you so wish.• Resistance lines can only be drawn down (unless a channel line).• Support lines can only be drawn up (unless a channel line).I cannot overemphasise how important those last two points are. If the trend is down, Iwant to find points where the reaction to that trend is over. This means I can only draw aline that is in accordance with the trend.• Beware or drawing lines that are steep. It is highly likely they will be broken.• If a resistance line is broken, it can later be<strong>com</strong>e support and vice versa.
This leads us into the exact rules <strong>of</strong> how to build trend lines. The principle aim is to drawlines that others in the market are drawing as well. Crowd following trend lines can be verypowerful.• Trend lines can only be connected by two 5 bar Peak points.• Ideally no piece <strong>of</strong> data can <strong>com</strong>e between them.• Initially only connect the most recent Peak points and then move further back.• Channel lines have the same rules.This set <strong>of</strong> rules means that the number <strong>of</strong> trend lines you can actually draw is limited. Insome cases, there may only be one line. This method is also very useful in identifying asideways trend. If you can draw supports and resistances from the most recent Peak points,the market is in a sideways pattern. This will <strong>of</strong>ten be true long before Momentumindicators are signalling so.The acid test on whether a line is subject to crowd following is its performance the first timeit visits it. Price must respect the line by holding it perfection or by emphatically reactingquickly on a break <strong>of</strong> the line.
PatternsIn many ways, patterns are far easier to interpret than the myriad forms <strong>of</strong> momentum, inrespect that the pattern remains constant. Only its range, where the pattern is within thelarger scope <strong>of</strong> the chart and volume associated with it are variables. I typically referencethe state <strong>of</strong> momentum in relationship to a pattern. However, the perennial problem withpatterns is the sheer volume <strong>of</strong> them and how do you work out which ones are important?Without a sound filter check, you will be continually seeing patterns and being forced tomake decisions. It is no accident, that in my own trading armoury, there are just threetraditional patterns I care about. Candlesticks patterns can be the worst. From what I canmake out there is a pattern for every permutation <strong>of</strong> price action. This means that there isan answer to everything but a solution to nothing.We will look at those three patterns later, but first we will look at a few popular patterns,and you can decide their relevance.
Island ReversalsIsland Reversals used to represent one <strong>of</strong> the most powerful patterns. There frequency hasfallen, but the redefinition <strong>of</strong> data (for those that make the effort) means that this patternmust be respected. The golden rule is never to trade against an Island Reversal.• It is at least a 3 bar pattern. In an uptrend, the second bar has a low that is abovethe high <strong>of</strong> the previous and the third bar has a high that is below the low <strong>of</strong> thesecond. Effectively you can draw a circle around the pattern. The more bars withinthe formation, the more powerful the signal.Islands are rare in Financials, but more prevalent in <strong>com</strong>modities. This Bund Island back in2005 was a classic and all-time high for some years.
FX is an area where no one looks for Islands, but that does not mean they are not incrediblypowerful. The day is redefined to 6.a.m to 11 p.m. so ignores Asia. The chart below showsthe Eurodollar. Price mutates from a bullish Island that fails to develop, before forming abearish Island as a continuation pattern that sparked a major collapse.2011’s high in Soybeans redefined as 7 a.m. to 7.15p.m. set <strong>of</strong>f a steep downtrend.
Care must be taken, if using Islands on the Pit Only symbol for the S&P, as they arebe<strong>com</strong>ing more <strong>com</strong>mon. A rare Double Island formed the low, and the first correctionworked as well. The final bullish Island failed miserably before the top was formed by apattern that covered eight days. The large square uses the Pr<strong>of</strong>ile Area tool with the blueline representing the Point <strong>of</strong> Control for the entire trend. The Island closes below what isthe point <strong>of</strong> the most time in the trend, which means that the trend is down. This confirmsthat the market is top-heavy and qualifies the pattern. Finally, an Island yesterday hassignalled a bottom may be in place.
DOJI’SThis the only Candlestick pattern apart from Evening and Morning Stars that I reference.This is due to extensive testing <strong>of</strong> many Candlestick patterns that revealed that Doji’s werethe only one that had an independent bias without having to build elaborate ways andmeans <strong>of</strong> qualification. Doji’s take many forms but ultimately always act as a warning sign.The longer the timeframe the more significant, but Doji’s have more power than manypatterns when applied to very short timeframes, especially, when linked to volume.Traditionally they are regarded as a reversal pattern, but I place equal weight on them beinga continuation pattern on historical charts. This means that all historical Doji’s must beconfirmed by the subsequent price actionDoji’s are quantified by the Open and Close being identical or close together. Whilst theyhave little significance in a sideways trend, they do provide a bias within that pattern.However, it is in a trend that their true power emerges. Doji’s represent a tug <strong>of</strong> warbetween bulls and bears. The greater the range, the greater the war, (Long Legged Doji),although it is important to look at the days price action, in order to determine whetherthere was a sign <strong>of</strong> exhaustion there, as well. The daily crude chart shows a Long LeggedDoji after a swift two-day collapse. Logic suggests that after such a collapse, a period <strong>of</strong>short covering, or bottom picking, can create a bounce. However, the intraday chart showsthat the entire moves to the lows occurred at midnight in thin volume. The rest <strong>of</strong> the daywas a slow, steady grind higher. The Doji was created by a false move at the wrong time <strong>of</strong>day, and effectively the real volume for the day saw price simply tread water.
Price collapses once again until we have another series <strong>of</strong> four Doji’s with no range and lowvolume. Stochastic divergence from an oversold position encourages people to look for abottom. As I said earlier, I prefer Doji’s as a continuation as they traditionally suck players inagainst the trend. If new closing lows are made they are forced to exit. Large trend days arecaused by both short and long term, players being on the same side. When a historicaltrend ending formation fails, short term traders are encouraged to press this break, longterm players can add to trend positions, and there is long term stop loss selling from thosewho tried to pick the end <strong>of</strong> the trend.
Analysis from the Pr<strong>of</strong>ile Area Tool from the original break down point shows that the Point<strong>of</strong> Control is at the low <strong>of</strong> the trend. This means that there is an acceptance <strong>of</strong> value at thelows, which is negative. Therefore, whilst I am prepared to keep an open mind about whichway a break will <strong>com</strong>e, if new lows are made we are below fair value, which is bearish, and ashort position is placed.
It is important to understand the significance <strong>of</strong> the Point <strong>of</strong> Control being at the top orbottom <strong>of</strong> a trend. The Island example on the S&P showed control at the top. Price brokebelow it, which is a bearish signal. This example has control at the bottom. Price broke lowerwhich was bearish, as well. The selling intensified as the Stochastic crossed back downforcing those players out.
Intraday Doji’s can be qualified in a variety <strong>of</strong> ways. My preference is to look not just atvolume itself, but the volume for the time <strong>of</strong> day, and then <strong>com</strong>pare it to the 20-dayaverage for that time <strong>of</strong> day. The low in crude is a Hammer Doji. It is 10.30 a.m. so volume islow but is still double the average for the time <strong>of</strong> day. There is divergence on the Stochasticand a red square appears, which is my code based on Stochastic Step logic from Chapter 3<strong>of</strong> my previous book. That is just icing on the cake. I have a low risk entry at 81.66, with astop below the low, <strong>of</strong> 35 ticks. On the Pit opening, price surges, range expands and thevolume is four times its average, which means buyers are in charge. The market extendsinto the close where it settles at 84.17.
It is critical that Doji’s have some sort <strong>of</strong> qualification, if only on a basic level. The Nasdaqrally <strong>of</strong> the first quarter is a classic example where top pickers got punished. The rally had n<strong>of</strong>ewer than 19 Doji’s before a top was made. However, apart from when the top is made,the Stochastic only <strong>com</strong>es out <strong>of</strong> overbought at Doji 12. The two yellow circles highlight a<strong>com</strong>mon topping pattern in the traditional sense. A Tri Star Doji, which is three in a row.This encourages top pickers. Note that the day afterwards the market rallies strongly asonce again short-term players and long-term players are on the same side. I try to be activeand buy those days when the pattern fails in the same manner as the crude example earlier.When the top is made there is divergence in the Stochastic, and it occurs from below theoverbought zone. My Stochastic Step based divergence signal (red square), the day after thetop helps to confirm, but is not essential.
The top itself was a Shooting Star Doji on the highest intraday timeframe chart I reference(120-minute) for day trading, (apart from FX) and the volume was twice the average for thetime <strong>of</strong> day.
GapsFor me, Gaps were one <strong>of</strong> the first areas <strong>of</strong> concentration when I began trading. Before theadvent <strong>of</strong> <strong>com</strong>puters I used to receive a weekly printed chart book that I would fill as timeprogressed. It was impossible to add mathematical calculations to the data, which meantpure price action and Gaps were an obvious phenomena to analyse. Today, with the advent<strong>of</strong> almost 24 hour markets, much <strong>of</strong> the established theories have been lost, due in a largepart to trader’s laziness. This means that patterns can be found that many marketparticipants are unaware <strong>of</strong>. On many markets, the opening is largely superfluous as it is nota product or an auctioning process, due to that lack <strong>of</strong> depth in activity. Therefore, it makessense to redefine data to the point in time where depth increases. This is 7 a.m. for futuresand 6 a.m. for FX.There is plenty <strong>of</strong> nonsense written about different types <strong>of</strong> Gaps. This can be Breakout,Continuation, or Exhaustion Gaps. Breakout Gaps are the only ones that can be qualifiedinstantly, as they must occur after a sideways pattern. The others need the subsequentprice action to prove their accuracy.A <strong>com</strong>mon error, when looking back through data, is to only see the gaps that work. Thereality is that most gaps are filled on the same day and are therefore not visible. It is criticalthat you analyse the history <strong>of</strong> the market you are concerned with, in order to understandthe frequency <strong>of</strong> Gaps. The questions to ask are• How many opening gaps?• How many are filled the same day?• How many are filled within five days?• How many are filled within two hours <strong>of</strong> the gap appearing?
Fundamental Analysis.How to interpret News.A <strong>com</strong>mon mantra for a technical analyst is that the news is indeed already in the price. Thisseems a little too simplistic. Whilst there are times when price instantly adjusts to newinformation, this normally occurs when the market is fully aware <strong>of</strong> relevant economic orstatistical information being released. The sheer volume <strong>of</strong> statistics in recent years can bedebilitating and lead to paralysis for anyone who wants to hold positions over days andweeks. It is no easier for day traders. The risk is that you can be buffeted around by shorttermvolatility, and be negatively influenced by data that have just been released.Of course, this is without the constant stream <strong>of</strong> news and <strong>com</strong>ment regarding the Eurocrisis. The second half <strong>of</strong> 2011 saw this reach a crescendo as markets moved on just aboutany <strong>com</strong>ment from almost anybody. At one point in just two days, in early November, therewere no fewer than 140 <strong>com</strong>ments from politicians and central banks (I read them all, tookpictures <strong>of</strong> the stories and then looked at the market’s reaction on 1-minute charts). Whenmarkets moved on <strong>com</strong>ments from the Brazilian finance minister on the Euro bailout fund, Iknew we really were in the silly season.Squawks are very popular as they remove the need to track the news yourself, but it takesdiscipline not to be influenced unduly by <strong>com</strong>ments starting with “rumoured” or “sources”. Isubscribe to Graham Turners GFC Economics (www.gfceconomics.<strong>com</strong> and author <strong>of</strong> theCredit Crunch). He provides a succinct daily <strong>com</strong>mentary and a weekly chart book thatreanalyses and places in prospective the relevant economic statistics <strong>of</strong> the past seven daysfrom around the globe. I find this invaluable in staying close enough to the pertinenteconomics without getting so close that I lose perspective on what is important.
Part 3Putting it all together.Creating your structure.In trading, time and timing are critical to the success. The <strong>com</strong>mon plan <strong>of</strong> attack, especiallyon timing, is usually concentrated on creating <strong>com</strong>binations <strong>of</strong> momentum with patterns.This involves crossovers <strong>of</strong> indicators that have special, magical settings. Many <strong>of</strong> theexamples I have used have simply been the <strong>CQG</strong> defaults. It seems to have escaped manythat no matter much work and testing is done, the chances are that the <strong>com</strong>bination that isderived and its subsequent success are more to do with good money management,emotional stability or just plain great trading. It’s a cliché, but true based on the feedback Ireceive that you can give a great <strong>com</strong>mentary or set <strong>of</strong> technical set-ups to a poor traderand they’ll lose. Give a poor <strong>com</strong>mentary and set up to a great trader and they won’t losemuch.Therefore, to make technical analysis work you must structure the analysis in order that youfind it easy to use. There is no benefit developing a form <strong>of</strong> analysis that utilizes 1-minutebars if you don’t like spending hours in front <strong>of</strong> a screen. Choose correctly, and the technicalanalysis that you develop will support your trading. Remember thatTechnical Analysis is a Support Structure for good traders and an excuse for poor ones.In addition, you must over<strong>com</strong>e the hurdle <strong>of</strong> believing the support structure you havedeveloped. It is easy to have a few bad trades and begin to think the structure is flawed. Ifeel very fortunate that I have experienced two sides to trading over long periodsthroughout my career. The first period was when I worked in the market using justfundamentals, touch, an understanding <strong>of</strong> pure price action and some guesswork. Thesecond period began when I stumbled into a job that theoretically gave me the brief, timeand resources to embark on a 15 year voyage <strong>of</strong> discovery into what is a bottomless“Pandora’s box” <strong>of</strong> theory and experimentation.It is no accident that it was when I was forced myself to analyse week in, week out via the<strong>com</strong>mentaries that trading and technical analysis switched from being a random supportstructure to an actual live fluid methodology. The result is a lack <strong>of</strong> frustration at missingtrades, whilst all the excuses, disciplinary problems and laziness have evaporated. Structureis everything.