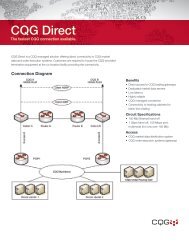
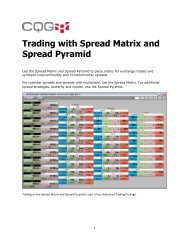
Mapping Your Voyage of Discovery - CQG.com
Mapping Your Voyage of Discovery - CQG.com
Mapping Your Voyage of Discovery - CQG.com
- No tags were found...

You also want an ePaper? Increase the reach of your titles
YUMPU automatically turns print PDFs into web optimized ePapers that Google loves.
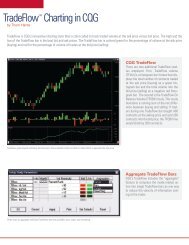
Percent <strong>of</strong> Average values represent percents <strong>of</strong> average volume. It is calculated as thearithmetic mean <strong>of</strong> total volume <strong>of</strong> all bars in the same session from the previous tradingday.Percent <strong>of</strong> Rank indicates where the bar falls relative to look back period.If the previous day's average is not available, then actual volume values will be displayed.No Normalization changes the bar colour to black and removes weighted volume. Range <strong>of</strong>the bid and ask is displayed.Volume Threshold (TFlow Vol): This chooses how the bars should look relative to volume.For example, if the percentage <strong>of</strong> volume is greater than 90, then the bid bar is bright redand asks is bright green. If the actual volume is greater than 10, but less than 50, the bid baris dark red and the ask is dark green.In my analysis, I kept the Vol Threshold type as the default, set the Aggregation at 13 anddisplayed the Volume study underneath the TFlow chart. If no volume appears, modify itand select Bid Ask. The Vol Threshold here is different to TFlow. Any number set abovezero, will show, within the histogram <strong>of</strong> volume, if there are any big chunks <strong>of</strong> volume.