Mapping Your Voyage of Discovery - CQG.com
Mapping Your Voyage of Discovery - CQG.com
Mapping Your Voyage of Discovery - CQG.com
- No tags were found...

You also want an ePaper? Increase the reach of your titles
YUMPU automatically turns print PDFs into web optimized ePapers that Google loves.
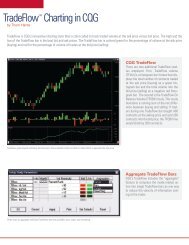
Next, place the volume study on the chart and modify it so it is showing the bid / askvolume. This also tells you whether buyers or sellers are in charge or if there are spikes inactivity.Take the normalised volume that misses the opening and closing and gauge where thenormal limits <strong>of</strong> volume are. On this market, it is typically between twenty and twenty fivethousand.This is now the volume range that you can use on the Constant Volume chart. The differencebetween that and a 10 minute chart may initially seems superficial, but analysis <strong>of</strong> the in thenumber <strong>of</strong> bars built in a day is considerable, with nearly twice as many Constant VolumeBars in the original pit hours. The morning session will build less and help preventmomentum flat lining.