Trading Time. - CQG.com
Trading Time. - CQG.com
Trading Time. - CQG.com

You also want an ePaper? Increase the reach of your titles
YUMPU automatically turns print PDFs into web optimized ePapers that Google loves.
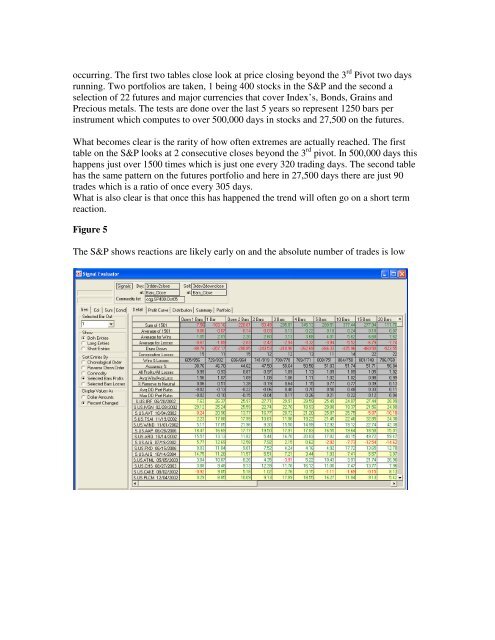
occurring. The first two tables close look at price closing beyond the 3 rd Pivot two days<br />
running. Two portfolios are taken, 1 being 400 stocks in the S&P and the second a<br />
selection of 22 futures and major currencies that cover Index’s, Bonds, Grains and<br />
Precious metals. The tests are done over the last 5 years so represent 1250 bars per<br />
instrument which <strong>com</strong>putes to over 500,000 days in stocks and 27,500 on the futures.<br />
What be<strong>com</strong>es clear is the rarity of how often extremes are actually reached. The first<br />
table on the S&P looks at 2 consecutive closes beyond the 3 rd pivot. In 500,000 days this<br />
happens just over 1500 times which is just one every 320 trading days. The second table<br />
has the same pattern on the futures portfolio and here in 27,500 days there are just 90<br />
trades which is a ratio of once every 305 days.<br />
What is also clear is that once this has happened the trend will often go on a short term<br />
reaction.<br />
Figure 5<br />
The S&P shows reactions are likely early on and the absolute number of trades is low