PORT OF TYNE ANNUAL REPORT AND ACCOUNTS 2011
PORT OF TYNE ANNUAL REPORT AND ACCOUNTS 2011
PORT OF TYNE ANNUAL REPORT AND ACCOUNTS 2011
Create successful ePaper yourself
Turn your PDF publications into a flip-book with our unique Google optimized e-Paper software.
30/<strong>ANNUAL</strong> RE<strong>PORT</strong> <strong>AND</strong> <strong>ACCOUNTS</strong> <strong>2011</strong><br />
NOTES TO THE FINANCIAL STATEMENTS/31<br />
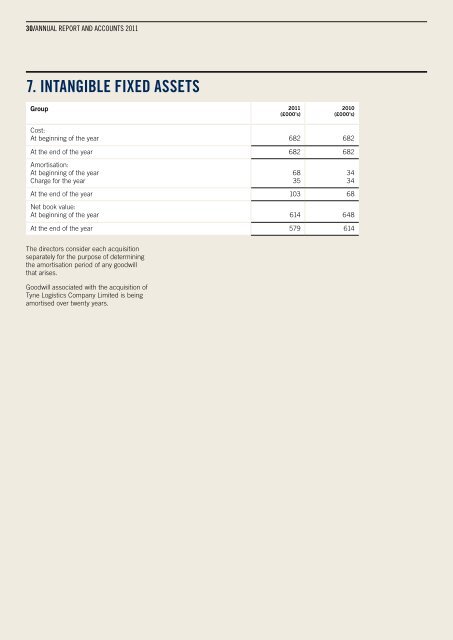
7. INTANGIBLE FIXED ASSETS 8. TANGIBLE FIXED ASSETS<br />
Group <strong>2011</strong><br />
(£000’s)<br />
2010<br />
(£000’s)<br />
Cost:<br />
At beginning of the year 682 682<br />
At the end of the year 682 682<br />
Amortisation:<br />
At beginning of the year<br />
Charge for the year<br />
At the end of the year 103 68<br />
Net book value:<br />
At beginning of the year 614 648<br />
At the end of the year 579 614<br />
The directors consider each acquisition<br />
separately for the purpose of determining<br />
the amortisation period of any goodwill<br />
that arises.<br />
Goodwill associated with the acquisition of<br />
Tyne Logistics Company Limited is being<br />
amortised over twenty years.<br />
68<br />
35<br />
34<br />
34<br />
Group<br />
Cost or valuation:<br />
At beginning of year<br />
Additions<br />
Transfers<br />
Disposals<br />
Revaluation<br />
Freehold land<br />
& buildings<br />
(£000’s)<br />
72,351<br />
979<br />
472<br />
(4)<br />
—<br />
Investment<br />
property<br />
(£000’s)<br />
47,165<br />
—<br />
—<br />
—<br />
833<br />
Infrastructure<br />
(£000’s)<br />
5,981<br />
—<br />
—<br />
—<br />
—<br />
Dredging<br />
(£000’s)<br />
5,377<br />
4,090<br />
56<br />
—<br />
—<br />
Craft, plant &<br />
machinery<br />
(£000’s)<br />
47,163<br />
1,331<br />
238<br />
(785)<br />
—<br />
Capital works<br />
in progress<br />
(£000’s)<br />
1,230<br />
3,818<br />
(766)<br />
—<br />
—<br />
Total<br />
(£000’s)<br />
179,267<br />
10,218<br />
—<br />
(789)<br />
833<br />
At end of year 73,798 47,998 5,981 9,523 47,947 4,282 189,529<br />
Depreciation:<br />
At beginning of year<br />
Charge for the year<br />
Impairment<br />
On disposals<br />
24,562<br />
2,486<br />
—<br />
(2)<br />
—<br />
—<br />
—<br />
—<br />
2,945<br />
115<br />
—<br />
—<br />
3,630<br />
137<br />
—<br />
—<br />
23,650<br />
2,846<br />
506<br />
(767)<br />
—<br />
—<br />
—<br />
—<br />
54,787<br />
5,584<br />
506<br />
(769)<br />
At end of year 27,046 — 3,060 3,767 26,235 — 60,108<br />
Net book value:<br />
At 31 December <strong>2011</strong> 46,752 47,998 2,921 5,756 21,712 4,282 129,421<br />
At 31 December 2010 47,789 47,165 3,036 1,747 23,513 1,230 124,480<br />
Leased assets included in<br />
the above:<br />
Net book value at 31 Dec <strong>2011</strong> — — — — 1,250 — 1,250<br />
Net book value at 31 Dec 2010 — — — — 1,436 — 1,436<br />
Authority<br />
Freehold land<br />
& buildings<br />
(£000’s)<br />
Investment<br />
property<br />
(£000’s)<br />
Infrastructure<br />
(£000’s)<br />
Dredging<br />
(£000’s)<br />
Craft, plant &<br />
machinery<br />
(£000’s)<br />
Capital works<br />
in progress<br />
(£000’s)<br />
Total<br />
(£000’s)<br />
Cost or valuation:<br />
At beginning of year<br />
Additions<br />
Transfers<br />
Disposals<br />
Revaluation<br />
72,351<br />
979<br />
472<br />
(4)<br />
—<br />
47,165<br />
—<br />
—<br />
—<br />
833<br />
5,981<br />
—<br />
—<br />
—<br />
—<br />
5,377<br />
4,090<br />
56<br />
—<br />
—<br />
44,234<br />
1,189<br />
238<br />
(779)<br />
—<br />
1,230<br />
3,818<br />
(766)<br />
—<br />
—<br />
176,338<br />
10,076<br />
—<br />
(783)<br />
833<br />
At end of year 73,798 47,998 5,981 9,523 44,882 4,282 186,464<br />
Depreciation:<br />
At beginning of year<br />
Charge for the year<br />
Impairment<br />
On disposals<br />
24,562<br />
2,486<br />
—<br />
(2)<br />
—<br />
—<br />
—<br />
—<br />
2,945<br />
115<br />
—<br />
—<br />
3,630<br />
137<br />
—<br />
—<br />
22,061<br />
2,572<br />
506<br />
(764)<br />
—<br />
—<br />
—<br />
—<br />
53,198<br />
5,310<br />
506<br />
(766)<br />
At end of year 27,046 — 3,060 3,767 24,375 — 58,248<br />
Net book value:<br />
At 31 December <strong>2011</strong> 46,752 47,998 2,921 5,756 20,507 4,282 128,216<br />
At 31 December 2010 47,789 47,165 3,036 1,747 22,173 1,230 123,140<br />
Leased assets included in<br />
the above:<br />
Net book value at 31 Dec <strong>2011</strong> — — — — 847 — 847<br />
Net book value at 31 Dec 2010 — — — — 942 — 942


