Excitation of the Chandler wobble by the geophysical annual cycle
Excitation of the Chandler wobble by the geophysical annual cycle
Excitation of the Chandler wobble by the geophysical annual cycle

Create successful ePaper yourself
Turn your PDF publications into a flip-book with our unique Google optimized e-Paper software.
<strong>Excitation</strong> <strong>of</strong> <strong>the</strong> <strong>Chandler</strong> <strong>wobble</strong> <strong>by</strong> <strong>the</strong> <strong>geophysical</strong><br />
<strong>annual</strong> <strong>cycle</strong><br />
W. Kosek<br />
Space Research Centre, Polish Academy <strong>of</strong> Sciences, Bartycka 18A, 00-716 Warsaw, Poland.<br />
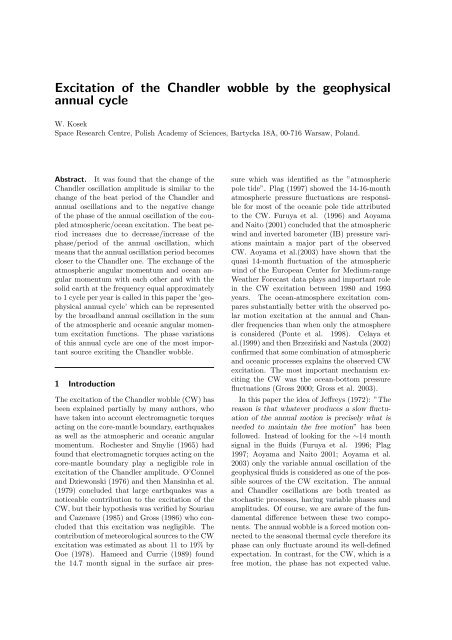
Abstract. It was found that <strong>the</strong> change <strong>of</strong> <strong>the</strong><br />
<strong>Chandler</strong> oscillation amplitude is similar to <strong>the</strong><br />
change <strong>of</strong> <strong>the</strong> beat period <strong>of</strong> <strong>the</strong> <strong>Chandler</strong> and<br />
<strong>annual</strong> oscillations and to <strong>the</strong> negative change<br />
<strong>of</strong> <strong>the</strong> phase <strong>of</strong> <strong>the</strong> <strong>annual</strong> oscillation <strong>of</strong> <strong>the</strong> coupled<br />
atmospheric/ocean excitation. The beat period<br />
increases due to decrease/increase <strong>of</strong> <strong>the</strong><br />
phase/period <strong>of</strong> <strong>the</strong> <strong>annual</strong> oscillation, which<br />
means that <strong>the</strong> <strong>annual</strong> oscillation period becomes<br />
closer to <strong>the</strong> <strong>Chandler</strong> one. The exchange <strong>of</strong> <strong>the</strong><br />
atmospheric angular momentum and ocean angular<br />
momentum with each o<strong>the</strong>r and with <strong>the</strong><br />
solid earth at <strong>the</strong> frequency equal approximately<br />
to 1 <strong>cycle</strong> per year is called in this paper <strong>the</strong> ’<strong>geophysical</strong><br />
<strong>annual</strong> <strong>cycle</strong>’ which can be represented<br />
<strong>by</strong> <strong>the</strong> broadband <strong>annual</strong> oscillation in <strong>the</strong> sum<br />
<strong>of</strong> <strong>the</strong> atmospheric and oceanic angular momentum<br />
excitation functions. The phase variations<br />
<strong>of</strong> this <strong>annual</strong> <strong>cycle</strong> are one <strong>of</strong> <strong>the</strong> most important<br />
source exciting <strong>the</strong> <strong>Chandler</strong> <strong>wobble</strong>.<br />
1 Introduction<br />
The excitation <strong>of</strong> <strong>the</strong> <strong>Chandler</strong> <strong>wobble</strong> (CW) has<br />
been explained partially <strong>by</strong> many authors, who<br />
have taken into account electromagnetic torques<br />
acting on <strong>the</strong> core-mantle boundary, earthquakes<br />
as well as <strong>the</strong> atmospheric and oceanic angular<br />
momentum. Rochester and Smylie (1965) had<br />
found that electromagnetic torques acting on <strong>the</strong><br />
core-mantle boundary play a negligible role in<br />
excitation <strong>of</strong> <strong>the</strong> <strong>Chandler</strong> amplitude. O’Connel<br />
and Dziewonski (1976) and <strong>the</strong>n Mansinha et al.<br />
(1979) concluded that large earthquakes was a<br />
noticeable contribution to <strong>the</strong> excitation <strong>of</strong> <strong>the</strong><br />
CW, but <strong>the</strong>ir hypo<strong>the</strong>sis was verified <strong>by</strong> Souriau<br />
and Cazenave (1985) and Gross (1986) who concluded<br />
that this excitation was negligible. The<br />
contribution <strong>of</strong> meteorological sources to <strong>the</strong> CW<br />
excitation was estimated as about 11 to 19% <strong>by</strong><br />
Ooe (1978). Hameed and Currie (1989) found<br />
<strong>the</strong> 14.7 month signal in <strong>the</strong> surface air pressure<br />
which was identified as <strong>the</strong> ”atmospheric<br />
pole tide”. Plag (1997) showed <strong>the</strong> 14-16-month<br />
atmospheric pressure fluctuations are responsible<br />
for most <strong>of</strong> <strong>the</strong> oceanic pole tide attributed<br />
to <strong>the</strong> CW. Furuya et al. (1996) and Aoyama<br />
and Naito (2001) concluded that <strong>the</strong> atmospheric<br />
wind and inverted barometer (IB) pressure variations<br />
maintain a major part <strong>of</strong> <strong>the</strong> observed<br />
CW. Aoyama et al.(2003) have shown that <strong>the</strong><br />
quasi 14-month fluctuation <strong>of</strong> <strong>the</strong> atmospheric<br />
wind <strong>of</strong> <strong>the</strong> European Center for Medium-range<br />
Wea<strong>the</strong>r Forecast data plays and important role<br />
in <strong>the</strong> CW excitation between 1980 and 1993<br />
years. The ocean-atmosphere excitation compares<br />
substantially better with <strong>the</strong> observed polar<br />
motion excitation at <strong>the</strong> <strong>annual</strong> and <strong>Chandler</strong><br />
frequencies than when only <strong>the</strong> atmosphere<br />
is considered (Ponte et al. 1998). Celaya et<br />
al.(1999) and <strong>the</strong>n Brzeziński and Nastula (2002)<br />
confirmed that some combination <strong>of</strong> atmospheric<br />
and oceanic processes explains <strong>the</strong> observed CW<br />
excitation. The most important mechanism exciting<br />
<strong>the</strong> CW was <strong>the</strong> ocean-bottom pressure<br />
fluctuations (Gross 2000; Gross et al. 2003).<br />
In this paper <strong>the</strong> idea <strong>of</strong> Jeffreys (1972): ”The<br />
reason is that whatever produces a slow fluctuation<br />
<strong>of</strong> <strong>the</strong> <strong>annual</strong> motion is precisely what is<br />
needed to maintain <strong>the</strong> free motion” has been<br />
followed. Instead <strong>of</strong> looking for <strong>the</strong> ∼14 month<br />
signal in <strong>the</strong> fluids (Furuya et al. 1996; Plag<br />
1997; Aoyama and Naito 2001; Aoyama et al.<br />
2003) only <strong>the</strong> variable <strong>annual</strong> oscillation <strong>of</strong> <strong>the</strong><br />
<strong>geophysical</strong> fluids is considered as one <strong>of</strong> <strong>the</strong> possible<br />
sources <strong>of</strong> <strong>the</strong> CW excitation. The <strong>annual</strong><br />
and <strong>Chandler</strong> oscillations are both treated as<br />
stochastic processes, having variable phases and<br />
amplitudes. Of course, we are aware <strong>of</strong> <strong>the</strong> fundamental<br />
difference between <strong>the</strong>se two components.<br />
The <strong>annual</strong> <strong>wobble</strong> is a forced motion connected<br />
to <strong>the</strong> seasonal <strong>the</strong>rmal <strong>cycle</strong> <strong>the</strong>refore its<br />
phase can only fluctuate around its well-defined<br />
expectation. In contrast, for <strong>the</strong> CW, which is a<br />
free motion, <strong>the</strong> phase has not expected value.
2E+003 2E+003 2E+003 2E+003 2E+003 2E+003<br />
2E+003 2E+003 2E+003 2E+003 2E+003 2E+003<br />
Even <strong>the</strong> sudden reversal <strong>of</strong> phase is possible<br />
for <strong>the</strong> observational evidence (see Vondrak and<br />
Ron, this issue) and for <strong>the</strong> <strong>the</strong>oretical model<br />
(see Brzeziński, this issue).<br />
To detect variations <strong>of</strong> <strong>the</strong> amplitudes and<br />
phases <strong>of</strong> <strong>the</strong> stochastic <strong>Chandler</strong> and <strong>annual</strong><br />
oscillations <strong>the</strong> least-squares (LS) method was<br />
applied in finite time intervals sliding along <strong>the</strong><br />
whole time interval <strong>of</strong> <strong>the</strong> pole coordinates data.<br />
The variations <strong>of</strong> <strong>the</strong> <strong>annual</strong> oscillation phase in<br />
<strong>the</strong> pole coordinates data (Kosek et al. 2001,<br />
2002) suggest that <strong>the</strong> phase <strong>of</strong> <strong>the</strong> <strong>annual</strong> oscillation<br />
in <strong>the</strong> <strong>geophysical</strong> fluids is also variable.<br />
The variations <strong>of</strong> <strong>the</strong> phase and amplitude <strong>of</strong> this<br />
<strong>annual</strong> oscillation in <strong>the</strong> <strong>geophysical</strong> fluids, which<br />
is called in this paper as <strong>the</strong> <strong>geophysical</strong> <strong>annual</strong><br />
<strong>cycle</strong>, can be one <strong>of</strong> <strong>the</strong> most important source<br />
exciting <strong>the</strong> CW due to leakage <strong>of</strong> <strong>the</strong> power from<br />
<strong>the</strong> <strong>annual</strong> to <strong>Chandler</strong> frequency band in <strong>the</strong><br />
fluid excitation function.<br />
2 Data<br />
The following data sets were used in <strong>the</strong> analysis:<br />
1) <strong>the</strong> x, y pole coordinates data from <strong>the</strong> IERS<br />
C04 in 1962.0 - 2004.5 with 1 day sampling interval<br />
and <strong>the</strong> IERS C01 in 1846 - 2002 with 0.1 year<br />
sampling interval in 1946-1889 years and 0.05<br />
year sampling interval afterwards(IERS 2003).<br />
In some cases <strong>the</strong> C04 data were extended into<br />
<strong>the</strong> past before 1962 year <strong>by</strong> <strong>the</strong> smoo<strong>the</strong>d and<br />
interpolated with 1 days sampling interval C01<br />
data. 2) <strong>the</strong> equatorial components <strong>of</strong> <strong>the</strong> effective<br />
atmospheric angular momentum (AAM)<br />
reanalysis data in 1948.0-2004.0 from <strong>the</strong> U.S.<br />
NCEP/NCAR, <strong>the</strong> top <strong>of</strong> <strong>the</strong> model is 10 hPa<br />
(Barnes et al. 1983; Salstein et al. 1986, Kalnay<br />
et al. 1996). 3) <strong>the</strong> equatorial components <strong>of</strong><br />
global oceanic angular momentum (OAM) mass<br />
and motion terms from Jan 1980 to Mar 2002<br />
with 1 day sampling interval (Gross et al. 2003).<br />
3 Coherence between <strong>the</strong> geodetic and<br />
atmospheric/oceanic excitation functions<br />
The geodetic excitation (GE) functions were<br />
computed from <strong>the</strong> C04 pole coordinates data using<br />
<strong>the</strong> time domain Wilson and Haubrich (1976)<br />
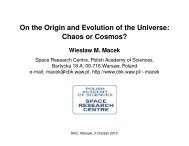
deconvolution formula. The time-frequency<br />
Morlet Wavelet Transform (MWT) coherences<br />
(Popiński and Kosek 2000; Popiński et al. 2002)<br />
between <strong>the</strong> complex-valued GE and AAM as<br />
well as GE and <strong>the</strong> sum <strong>of</strong> <strong>the</strong> atmospheric and<br />
oceanic (AAM+OAM) excitation functions were<br />
computed and are shown in Figure 1. In this<br />
analysis <strong>the</strong> AAM excitation functions are <strong>the</strong><br />
sum <strong>of</strong> wind and pressure modified <strong>by</strong> inverted<br />
barometer correction terms and <strong>the</strong> OAM excitation<br />
functions are <strong>the</strong> sum <strong>of</strong> <strong>the</strong> mass and<br />
motion terms. The MWT coherence as <strong>the</strong> running<br />
correlation coefficient between <strong>the</strong> wavelet<br />
transform coefficients computed using <strong>the</strong> Morlet<br />
wavelet analyzing function (Schmitz-Hübsch<br />
and Schuh 1999) shows <strong>the</strong> amplitude and phase<br />
agreement as a function <strong>of</strong> time and frequency<br />
in <strong>the</strong> geodetic and fluid excitation functions. It<br />
can be noticed that after adding <strong>the</strong> OAM to <strong>the</strong><br />
AAM <strong>the</strong> coherence becomes greater in <strong>the</strong> vicinity<br />
<strong>of</strong> <strong>the</strong> <strong>Chandler</strong> and <strong>annual</strong> frequencies but<br />
especially for oscillations with periods less than<br />
1 year.<br />
period (days)<br />
500<br />
300<br />
100<br />
-200<br />
-400<br />
-600<br />
500<br />
300<br />
100<br />
-200<br />
-400<br />
GE & AAM<br />
1970 1975 1980 1985 1990 1995<br />
GE & AAM<br />
GE & (AAM + OAM)<br />
-600<br />
1966 1970 1974 1978 1982 1986 1990 1994 1998<br />
years<br />
Fig. 1. The MWT spectro-temporal coherences between<br />
<strong>the</strong> complex-valued GE and AAM as well as<br />
GE and AAM+OAM excitation functions.<br />
Analysis <strong>of</strong> <strong>the</strong> phasor diagrams <strong>of</strong> <strong>the</strong> <strong>annual</strong><br />
excitation in <strong>the</strong> AAM and OAM excitation functions<br />
have shown that <strong>the</strong>ir sum has a better<br />
agreement with <strong>the</strong> GE functions than <strong>the</strong> AAM<br />
excitation function alone (Brzeziński et al. 2005;<br />
Gross et al. 2003).<br />
4 Amplitudes and phases <strong>of</strong> <strong>the</strong> <strong>Chandler</strong><br />
and <strong>annual</strong> oscillations<br />
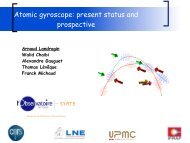
The <strong>Chandler</strong> and <strong>annual</strong> oscillation amplitudes<br />
were computed toge<strong>the</strong>r with <strong>the</strong>ir phases <strong>by</strong> <strong>the</strong><br />
LS method (Fig. 2). The time interval <strong>of</strong> <strong>the</strong><br />
complex-valued C04 pole coordinates data going<br />
into <strong>the</strong> LS model which consists <strong>of</strong> <strong>the</strong> <strong>Chandler</strong><br />
circle, <strong>annual</strong> and semi<strong>annual</strong> ellipses (McCarthy<br />
and Luzum 1991; Kosek et al. 2002) was equal<br />
0.9<br />
0.8<br />
0.7<br />
0.6<br />
0.5<br />
0.4<br />
0.3<br />
0.2<br />
0.1
to 5 years. The amplitude and phase variations<br />
<strong>of</strong> <strong>the</strong> <strong>Chandler</strong> oscillation are much smo<strong>the</strong>r<br />
than <strong>of</strong> <strong>the</strong> <strong>annual</strong> one as it has been previously<br />
noticed <strong>by</strong> Schuh et al. (2001), Kosek et al.<br />
(2001, 2002) and Höpfner (2002, 2003). Next,<br />
<strong>the</strong> <strong>Chandler</strong> amplitude was also computed as<br />
<strong>the</strong> envelope <strong>of</strong> <strong>the</strong> <strong>Chandler</strong> oscillation filtered<br />
from <strong>the</strong> extended into <strong>the</strong> past before 1962 year<br />
complex-valued C04 pole coordinates data using<br />
<strong>the</strong> Fourier transform band pass filter (FTBPF)<br />
(Kosek 1995) with <strong>the</strong> optimum frequency bandwidth<br />
(Fig. 2). The optimum frequency bandwidth<br />
was chosen so that <strong>the</strong> variance <strong>of</strong> <strong>the</strong><br />
residuals after subtracting <strong>the</strong> filtered <strong>Chandler</strong><br />
and <strong>annual</strong> oscillations was a minimum. The<br />
agreement between <strong>the</strong> amplitude variations <strong>of</strong><br />
<strong>the</strong> <strong>Chandler</strong> oscillation computed <strong>by</strong> <strong>the</strong> LS and<br />
FTBPF methods is very good (Fig. 2).<br />
arcsec<br />
0.2<br />
0.1<br />
amplitudes<br />
0.0<br />
o<br />
50<br />
40<br />
phases<br />
30<br />
20<br />
10<br />
0<br />
Ch - long period<br />
-10<br />
1980 1984 1988 1992 1996 2000<br />
years<br />
Ch<br />
An<br />
Fig. 2. The envelope <strong>of</strong> <strong>the</strong> <strong>Chandler</strong> oscillations<br />
filtered <strong>by</strong> <strong>the</strong> FTBPF (circles). The LS amplitudes<br />
and phases <strong>of</strong> <strong>the</strong> <strong>Chandler</strong> (black line) and <strong>annual</strong> (x<br />
- blue line. y - red line) oscillations, and <strong>the</strong> phase <strong>of</strong><br />
<strong>the</strong> <strong>Chandler</strong> oscillation after removing long period<br />
variations <strong>by</strong> <strong>the</strong> LS method (dots).<br />
The aim <strong>of</strong> this investigation is to find <strong>the</strong> excitation<br />
mechanism responsible for <strong>the</strong> variations<br />
<strong>of</strong> <strong>the</strong> <strong>Chandler</strong> amplitude.<br />
5 The beat period <strong>of</strong> <strong>the</strong> <strong>Chandler</strong> and<br />
<strong>annual</strong> oscillations<br />
A change <strong>of</strong> a phase ∆ϕ(t) <strong>of</strong> an oscillation with<br />
variable frequency is associated with an opposite<br />
change <strong>of</strong> a period ∆T (t) according to:<br />
2πt/T m + ∆ϕ(t) = 2πt/(T m + ∆T (t)) (1)<br />
where T m is <strong>the</strong> mean period <strong>of</strong> oscillation.<br />
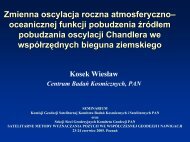
Assuming <strong>the</strong> mean values <strong>of</strong> <strong>the</strong> <strong>Chandler</strong><br />
and <strong>annual</strong> periods, equal to T Ch = 434.0 days,<br />
T An = 365.2422 days, respectively <strong>the</strong>ir period<br />
variations were computed (Fig. 3) from <strong>the</strong>ir<br />
phase variations shown in Figure 2. The free<br />
An<br />
Ch<br />
CW oscillation phase shows low frequency variations<br />
explained <strong>by</strong> variations <strong>of</strong> <strong>the</strong> <strong>Chandler</strong><br />
frequency (Vondrak 1985). The <strong>Chandler</strong> frequency<br />
variations were detected <strong>by</strong> many authors<br />
(Carter 1981; Okubo 1982; Lenhart and Groten<br />
1987; Vicente and Wilson 1997; De-Chun and<br />
Yong-Hong 2004). To use eq. 2 for computation<br />
<strong>of</strong> <strong>the</strong> <strong>Chandler</strong> period variations from it’s<br />
variable phase determined <strong>by</strong> <strong>the</strong> LS method <strong>the</strong><br />
longer period variations <strong>of</strong> <strong>the</strong> phase were removed<br />
(Fig. 2. dots) to keep <strong>the</strong> expected value<br />
<strong>of</strong> <strong>the</strong> <strong>Chandler</strong> frequency constant. The long period<br />
variations <strong>of</strong> <strong>the</strong> <strong>Chandler</strong> phase were computed<br />
<strong>by</strong> <strong>the</strong> LS model fit to <strong>the</strong> last 50 years<br />
<strong>of</strong> <strong>the</strong> <strong>Chandler</strong> phase data. This LS model consisted<br />
<strong>of</strong> oscillation with periods <strong>of</strong> 70 and 140<br />
years.<br />
days<br />
440<br />
periods<br />
420<br />
400<br />
380<br />
360<br />
340<br />
o<br />
C<br />
4<br />
Nino 1+2 Nino 3 Nino 4<br />
2<br />
0<br />
-2<br />
1980 1984 1988 1992 1996 2000<br />
years<br />
Fig. 3. The period variations <strong>of</strong> <strong>the</strong> <strong>Chandler</strong> (black<br />
line) and <strong>annual</strong> (x - blue line. y - red line) oscillations<br />
computed from <strong>the</strong>ir LS phase variations shown<br />
in Figure 2. The Niño 1+2, 3 and 4 indices.<br />
It can be noticed that <strong>the</strong> <strong>Chandler</strong> period<br />
is much smoo<strong>the</strong>r than <strong>the</strong> <strong>annual</strong> one and before<br />
<strong>the</strong> biggest El Niño events in 1982/83 and<br />
1997/98 <strong>the</strong> period <strong>of</strong> <strong>the</strong> <strong>annual</strong> oscillation<br />
had minimum values and increased during <strong>the</strong>se<br />
events (Fig. 3). It has been previously found<br />
that <strong>the</strong> amplitude and phase/period variations<br />
<strong>of</strong> <strong>the</strong> <strong>annual</strong> oscillation are correlated with <strong>the</strong><br />
biggest El Niño events (Kosek 2003, 2004; Kosek<br />
et al. 2001, 2002). Next, <strong>the</strong> variable beat period<br />
T b (t) <strong>of</strong> <strong>the</strong> <strong>Chandler</strong> and <strong>annual</strong> oscillations<br />
were computed from <strong>the</strong> <strong>the</strong>ir period variations<br />
<strong>by</strong> <strong>the</strong> formula:<br />
1<br />
T b (t) = 1<br />
T An + ∆T An (t) − 1<br />
T Ch + ∆T Ch (t) (2)<br />
where ∆T Ch (t), ∆T An (t) are <strong>the</strong> <strong>Chandler</strong> and<br />
<strong>annual</strong> oscillation period variations about <strong>the</strong><br />
mean.<br />
Most part <strong>of</strong> <strong>the</strong> beat period variations shown<br />
in Figure 5 are caused <strong>by</strong> <strong>the</strong> phase (Fig. 2) or<br />
Ch<br />
An
period (Fig. 3) variations <strong>of</strong> <strong>the</strong> <strong>annual</strong> oscillation.<br />
The beat period variations can be also<br />
computed from polar motion radius data given<br />
<strong>by</strong> <strong>the</strong> formula:<br />
R(t) = √ (x(t) − x m (t)) 2 + (y(t) − y m (t)) 2 (3)<br />
where x(t), y(t) are <strong>the</strong> extended into <strong>the</strong> past<br />
C04 pole coordinates data, and x m (t), y m (t) are<br />
<strong>the</strong> mean pole coordinates data.<br />
To obtain <strong>the</strong> radius <strong>the</strong> mean pole coordinates<br />
data were computed <strong>by</strong> <strong>the</strong> Orms<strong>by</strong> (1961) low<br />
pass filter. The Orms<strong>by</strong> filter parameters were<br />
assumed to minimize <strong>the</strong> variance <strong>of</strong> <strong>the</strong> residual<br />
<strong>Chandler</strong> and <strong>annual</strong> oscillations in <strong>the</strong> mean<br />
pole coordinates data (Kosek et al. 2004). The<br />
most energetic oscillation <strong>of</strong> <strong>the</strong> radius shown in<br />
Figure 4 has a period approximately equal to 6-<br />
7 years which is <strong>the</strong> beat period induced <strong>by</strong> <strong>the</strong><br />
superposition <strong>of</strong> <strong>the</strong> <strong>Chandler</strong> and <strong>annual</strong> oscillations.<br />
arcsec<br />
radius<br />
0.3<br />
0.2<br />
0.1<br />
0.0<br />
o<br />
200 phases<br />
180<br />
1962 1968 1974 1980 1986 1992 1998 2004<br />
years<br />
Fig. 4. The polar motion radius (black line) and <strong>the</strong><br />
phase variations <strong>of</strong> <strong>the</strong> 6-7 years oscillation computed<br />
<strong>by</strong> <strong>the</strong> LS method in 12 (green line) and 13 (blue line)<br />
years time intervals.<br />
Next, <strong>the</strong> phase variations <strong>of</strong> <strong>the</strong> 6-7 years oscillation<br />
were computed <strong>by</strong> <strong>the</strong> LS method from<br />
<strong>the</strong> radius data (Fig. 4). The LS model consists<br />
<strong>of</strong> oscillation with periods <strong>of</strong> 6.37, 20 and<br />
40 years and it is fit to <strong>the</strong> 12 and 13 years <strong>of</strong><br />
<strong>the</strong> radius data. These phase variations toge<strong>the</strong>r<br />
with <strong>the</strong> mean beat period value estimated from<br />
eq. 2 for ∆T Ch (t) = ∆T An (t) = 0 enable computation<br />
<strong>of</strong> <strong>the</strong> beat period variations <strong>by</strong> eq. 1.<br />
The beat period variations computed from <strong>the</strong><br />
radius data are smoo<strong>the</strong>r than those computed<br />
from <strong>the</strong> LS phases <strong>of</strong> <strong>the</strong> <strong>Chandler</strong> and <strong>annual</strong><br />
oscillation due to longer time span <strong>of</strong> averaging<br />
in <strong>the</strong> first case (Fig. 5). The <strong>Chandler</strong> amplitude<br />
changes obtained as <strong>the</strong> first difference <strong>of</strong><br />
<strong>the</strong> <strong>Chandler</strong> amplitude variations computed <strong>by</strong><br />
<strong>the</strong> LS method are shown in Figure 5. The LS<br />
model <strong>of</strong> <strong>the</strong> <strong>Chandler</strong> circle, <strong>annual</strong> and semi<strong>annual</strong><br />
ellipses is fit to 4, 5 and 6 years <strong>of</strong> <strong>the</strong><br />
complex-valued C04 pole coordinates data.<br />
Next, <strong>the</strong> phase variations <strong>of</strong> <strong>the</strong> <strong>annual</strong> oscillation<br />
were computed from <strong>the</strong> complex-valued<br />
AAM+OAM excitation functions data <strong>by</strong> <strong>the</strong> LS<br />
method (Fig. 5). The LS model consists <strong>of</strong> <strong>the</strong><br />
<strong>annual</strong> oscillation and it is fit to 3 and 4 years <strong>of</strong><br />
<strong>the</strong> AAM+OAM data.<br />
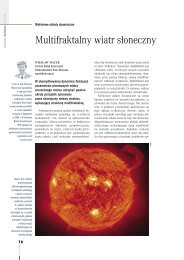
years<br />
6.6<br />
beat period from <strong>the</strong> radius<br />
6.4<br />
6.2<br />
years<br />
8<br />
beat period from <strong>the</strong> phases <strong>of</strong> Ch and An<br />
7<br />
6<br />
5<br />
4<br />
mas/day<br />
0.10<br />
<strong>Chandler</strong> amplitude change<br />
0.05<br />
0.00<br />
-0.05<br />
-0.10<br />
o<br />
310 AAM + OAM<br />
300<br />
290<br />
1980 1984 1988 1992 1996 2000<br />
years<br />
Fig. 5. The period variations <strong>of</strong> <strong>the</strong> 6-7 years oscillation<br />
computed from <strong>the</strong> LS phases in 12 (green<br />
line) and 13 (blue line) years time intervals from <strong>the</strong><br />
radius data. The beat period computed from <strong>the</strong> LS<br />
phases <strong>of</strong> <strong>the</strong> <strong>Chandler</strong> and <strong>annual</strong> oscillations in 4<br />
(black line), 5 (blue line) and 6 (green line) year time<br />
intervals. The <strong>Chandler</strong> amplitude change computed<br />
<strong>by</strong> <strong>the</strong> LS method in 4 (black line) 5 (blue line) and<br />
6 (green line) year time intervals. The LS phases <strong>of</strong><br />
<strong>the</strong> <strong>annual</strong> oscillation computed from <strong>the</strong> complexvalued<br />
AAM+OAM excitation functions in 3 (red<br />
line) and 4 (black line) year time intervals.<br />
6 The physical mechanism <strong>of</strong> <strong>the</strong> <strong>Chandler</strong><br />
Wobble excitation<br />
It can be noticed that after 1984 when <strong>the</strong> accuracy<br />
<strong>of</strong> polar motion data became better <strong>the</strong><br />
variations <strong>of</strong> <strong>the</strong> beat period estimated from <strong>the</strong><br />
radius data and from <strong>the</strong> LS phases <strong>of</strong> <strong>the</strong> <strong>Chandler</strong><br />
and <strong>annual</strong> oscillations are similar (Fig. 5).<br />
The beat period variations are also similar to <strong>the</strong><br />
<strong>Chandler</strong> amplitude change as well as to <strong>the</strong> negative<br />
change <strong>of</strong> <strong>the</strong> LS phase <strong>of</strong> <strong>the</strong> <strong>annual</strong> oscillation<br />
computed from <strong>the</strong> AAM+OAM excitation<br />
functions (Fig. 5). The correlation coefficient between<br />
<strong>the</strong> beat period computed from <strong>the</strong> radius<br />
data in 13 year time intervals and <strong>the</strong> <strong>Chandler</strong><br />
amplitude change computed <strong>by</strong> <strong>the</strong> LS method in<br />
6 year time intervals is equal to 0.51. The correlation<br />
coefficient between variations <strong>of</strong> <strong>the</strong> beat<br />
period <strong>of</strong> <strong>the</strong> <strong>Chandler</strong> and <strong>annual</strong> oscillations<br />
computed from <strong>the</strong>ir LS phases in 6 year time in-
tervals and <strong>the</strong> <strong>Chandler</strong> amplitude change computed<br />
<strong>by</strong> <strong>the</strong> LS method in 6 year time intervals<br />
is equal to 0.65. The correlation coefficient between<br />
<strong>the</strong> <strong>Chandler</strong> amplitude change computed<br />
<strong>by</strong> <strong>the</strong> LS method in 4 year time intervals and<br />
<strong>the</strong> phase variations <strong>of</strong> <strong>the</strong> <strong>annual</strong> oscillation in<br />
<strong>the</strong> AAM+OAM excitation functions computed<br />
<strong>by</strong> <strong>the</strong> LS method in 3 year time intervals is<br />
equal to 0.52. All <strong>the</strong>se correlation coefficient<br />
were computed from 1984 to <strong>the</strong> end <strong>of</strong> available<br />
data and are significant at 95% confidence level.<br />
These results suggest that <strong>the</strong> <strong>Chandler</strong> amplitude<br />
change is correlated with <strong>the</strong> beat period<br />
variations as well as with <strong>the</strong> phase variations<br />
<strong>of</strong> <strong>the</strong> <strong>annual</strong> oscillation in <strong>the</strong> AAM+OAM excitation<br />
functions. The physical mechanism <strong>of</strong><br />
<strong>the</strong> <strong>Chandler</strong> excitation can be explained as follows<br />
(Kosek 2004): The variations <strong>of</strong> <strong>the</strong> phase<br />
<strong>of</strong> <strong>the</strong> <strong>annual</strong> oscillation in <strong>the</strong> AAM+OAM excitation<br />
cause similar variations <strong>of</strong> phase <strong>of</strong> <strong>the</strong><br />
<strong>annual</strong> oscillation <strong>of</strong> polar motion. The decrease<br />
<strong>of</strong> this phase or increase <strong>of</strong> <strong>the</strong> <strong>annual</strong> oscillation<br />
period means that this period gets closer to <strong>the</strong><br />
<strong>Chandler</strong> one which causes <strong>the</strong> increase <strong>of</strong> <strong>the</strong><br />
beat period between <strong>the</strong> <strong>Chandler</strong> and <strong>annual</strong><br />
oscillation (Fig. 6). Thus, <strong>the</strong> <strong>Chandler</strong> amplitude<br />
change increases during decrease <strong>of</strong> <strong>the</strong><br />
phase <strong>of</strong> <strong>the</strong> <strong>annual</strong> oscillation in polar motion<br />
and its AAM+OAM excitation.<br />
T An<br />
T Ch<br />
Fig. 6. A graph showing that <strong>the</strong> increase/decrease<br />
<strong>of</strong> <strong>the</strong> <strong>annual</strong> oscillation period/phase results in <strong>the</strong><br />
increase <strong>of</strong> <strong>the</strong> beat period <strong>of</strong> <strong>the</strong> <strong>Chandler</strong> and <strong>annual</strong><br />
oscillations according to eqs. 1 and 2.<br />
Conclusions<br />
The amplitudes and phases <strong>of</strong> <strong>the</strong> <strong>Chandler</strong> oscillation<br />
are smoo<strong>the</strong>r than those <strong>of</strong> <strong>the</strong> <strong>annual</strong><br />
one. The change <strong>of</strong> <strong>the</strong> <strong>Chandler</strong> amplitude increases<br />
with <strong>the</strong> increase <strong>of</strong> <strong>the</strong> beat period <strong>of</strong><br />
<strong>the</strong> <strong>annual</strong> and <strong>Chandler</strong> oscillations and decrease<br />
<strong>of</strong> <strong>the</strong> phase <strong>of</strong> <strong>the</strong> <strong>annual</strong> oscillation in<br />
<strong>the</strong> pole coordinates data and <strong>the</strong> coupled atmospheric/ocean<br />
excitation. The beat period increases<br />
because <strong>the</strong> <strong>annual</strong> period gets closer to<br />
<strong>the</strong> <strong>Chandler</strong> one. Thus, one <strong>of</strong> <strong>the</strong> most possible<br />
source exciting <strong>the</strong> CW can be decrease <strong>of</strong> <strong>the</strong><br />
phase <strong>of</strong> <strong>the</strong> broadband <strong>annual</strong> oscillation in <strong>the</strong><br />
AAM+OAM excitation functions. The period <strong>of</strong><br />
<strong>the</strong> <strong>annual</strong> oscillation was a minimum before <strong>the</strong><br />
biggest 1982/83 and 1997/98 El Niño events and<br />
increased during <strong>the</strong>se events. Thus, <strong>the</strong> CW can<br />
be excited during <strong>the</strong> biggest El Niño events.<br />
Acknowledgments. This research was supported<br />
<strong>by</strong> <strong>the</strong> Polish Ministry <strong>of</strong> Scientific Research and<br />
Information Technology grant No. 5 T12E 039<br />
24. The author thanks Aleksander Brzeziński for<br />
his valuable comments and discussion.<br />
References<br />
Aoyama, Y., and Naito I., 2001, Atmospheric excitation<br />
<strong>of</strong> <strong>the</strong> <strong>Chandler</strong> <strong>wobble</strong>, 1983-1998. J.<br />
Geophys. Res. Solid Earth, 106, 8941–8954.<br />
Aoyama, Y., Naito I., Iwabuchu T., and Yamazaki<br />
N., 2003, Atmospheric quasi-14 month fluctuation<br />
and excitation <strong>of</strong> <strong>the</strong> <strong>Chandler</strong> <strong>wobble</strong>. Earth<br />
Planets Space 55, e25–e28.<br />
Barnes R.T.H., Hide R., White A.A., and Wilson<br />
C.A. 1983, Atmospheric Angular Momentum<br />
Fluctuations, length-<strong>of</strong>-day changes and polar<br />
motion, Proc. R. Soc. London, A387, 31–73.<br />
Brzeziński A. and Nastula J., 2002, Oceanic excitation<br />
<strong>of</strong> <strong>the</strong> <strong>Chandler</strong> <strong>wobble</strong>. Advances in Space<br />
Research, Vol. 30, No. 2, 195–200.<br />
Brzeziński A., Nastula J. and Ko̷laczek B., 2005,<br />
Oceanic excitation <strong>of</strong> polar motion from intraseasonal<br />
to decadal periods. in ”A Window on <strong>the</strong><br />
Future <strong>of</strong> Geodesy”, ed. F. Sanso, IAG Symposia,<br />
Vol. 128, Springer Verlag, Berlin Heidelberg.<br />
Carter W.E., 1981, Frequency modulation <strong>of</strong> <strong>the</strong><br />
<strong>Chandler</strong>ian component <strong>of</strong> polar motion., J. Geophys.<br />
Res., Vol. 86, No. B3, 1653–1658.<br />
Celaya M.A., Wahr J.M. and Bryan F.O. 1999,<br />
Climate-driven polar motion, J. Geophys. Res.,<br />
104, 12813–12829.<br />
De-Chun Liao and Yong-Hong Zhou, 2004, <strong>Chandler</strong><br />
Wobble Period and Q Derived <strong>by</strong> Wavelet Transform.,<br />
Chin. J. Astron. Astrophys. Vol. 4 (2004),<br />
No. 3, 247-257<br />
Furuya M. Hamano Y. and Naito I., 1996, Quasiperiodic<br />
wind signal as a possible excitation <strong>of</strong><br />
<strong>Chandler</strong> <strong>wobble</strong>. J. Geophys. Res., 101, 25537–<br />
25546.<br />
Gross R.S., 1986, The influence <strong>of</strong> earthquakes on <strong>the</strong><br />
<strong>Chandler</strong> <strong>wobble</strong> during 1977-1983., Geophys. J.<br />
R. astr. Soc. (1986) 85, 161–177.<br />
Gross R.S., 2000, The excitation <strong>of</strong> <strong>the</strong> <strong>Chandler</strong><br />
<strong>wobble</strong>, Geophys. Res. Lett., Vol. 27, No 15,<br />
Aug. 1, 2000, 2329–2332.<br />
Gross, R. S., I. Fukumori, and D. Menemenlis, 2003.<br />
Atmospheric and oceanic excitation <strong>of</strong> <strong>the</strong> Earth’s<br />
<strong>wobble</strong>s during 1980-2000, J. Geophys. Res., 108<br />
(B8), 2370, doi:10.1029/2002JB002143.
Hameed S. and Currie R.G., 1989, Simulation <strong>of</strong> <strong>the</strong><br />
14-month <strong>Chandler</strong> <strong>wobble</strong> in a global climate<br />
model., Geophys. Res. Lett. Vol. 16, No. 3,<br />
247–250.<br />
Höpfner J., 2002, Parameter variability <strong>of</strong> <strong>the</strong> observed<br />
<strong>Chandler</strong> and <strong>annual</strong> <strong>wobble</strong>s based on<br />
space-geodetic measurements. Zeitschrift fr Vermessungswesen,<br />
6/2002, 127, Jahrgang, 397–408.<br />
Höpfner J., 2003, Low-frequency variations, <strong>Chandler</strong><br />
and <strong>annual</strong> <strong>wobble</strong>s <strong>of</strong> polar motion as observed<br />
over one century, Scientific Technical Report<br />
STR03/01, Ge<strong>of</strong>orschungsZentrum Potsdam.<br />
IERS 2003, The Earth Orientation Parameters,<br />
http://hpiers.obspm.fr/eop-pc/.<br />
Jeffreys H. 1972, The variation <strong>of</strong> latitude, P. Melchior<br />
and Yumi S. (eds.) J. Rotation <strong>of</strong> <strong>the</strong> Earth,<br />
39-42.<br />
Kalnay E. et al., 1996, The NCEP/NCAR 40-year<br />
reanalysis project, Bull. Amer. Meteor. Soc., 77,<br />
437–471.<br />
Kosek W., 1995, Time Variable Band Pass Filter<br />
Spectra <strong>of</strong> Real and Complex-Valued Polar Motion<br />
Series, Artificial Satellites, No 24, Vol. 30,<br />
No 1, 27–43.<br />
Kosek, W., McCarthy D.D. and Luzum B.J., 2001,<br />
El Niño impact on polar motion prediction errors,<br />
Studia geophysica et geodetica 45, 347–361.<br />
Kosek W., McCarthy D.D. and Luzum B.J., 2002,<br />
Variations <strong>of</strong> <strong>annual</strong> oscillation parameters, El<br />
Niño and <strong>the</strong>ir influence on polar motion prediction<br />
errors, Proc. Journees 2001, Systemes de Reference<br />
Spatio-Temporels, 85–90.<br />
Kosek W., 2003, Polar motion prediction <strong>by</strong> different<br />
methods in polar coordinate system. Proc.<br />
Journees 2002, Systemes de Reference Spatio-<br />
Temporels, 125–131.<br />
Kosek W., McCarthy D.D., Johnson T.J., Kalarus<br />
M., 2004, Comparison <strong>of</strong> polar motion prediction<br />
results supplied <strong>by</strong> <strong>the</strong> IERS Sub-bureau for<br />
Rapid Service and Predictions and results <strong>of</strong> o<strong>the</strong>r<br />
prediction methods. Proc. Journees 2003, Systemes<br />
de Reference Spatio-Temporels, 164–169.<br />
Kosek W., 2004, Possible excitation <strong>of</strong> <strong>the</strong> <strong>Chandler</strong><br />
<strong>wobble</strong> <strong>by</strong> variable <strong>geophysical</strong> <strong>annual</strong> <strong>cycle</strong>., Artificial<br />
Satellites, Vol. 39, No 2., 135–145.<br />
Lenhardt H. and Groten E., 1987, <strong>Chandler</strong> Wobble<br />
Parameters from BIH and ILS data, Manuscripta<br />
Geodetica 10, 296–305.<br />
Mansinha L., Smylie D.E., and Chapman C.H., 1979,<br />
Seismic excitation <strong>of</strong> <strong>the</strong> <strong>Chandler</strong> <strong>wobble</strong> revisited.,<br />
Geophys. J. R. astr. Soc. (1979) 59, 1–17.<br />
McCarthy D.D. and Luzum B.J., 1991, Prediction <strong>of</strong><br />
Earth Orientation, Bull. God., 65, 18–21.<br />
O’Connell R.J. and Dziewonski A.M., 1976, <strong>Excitation</strong><br />
<strong>of</strong> <strong>the</strong> <strong>Chandler</strong> <strong>wobble</strong> <strong>by</strong> large earthquakes.<br />
Nature Vol. 262 July 22 1976. 259–262.<br />
Okubo S., 1982, Is <strong>the</strong> <strong>Chandler</strong> period variable ,<br />
Geophys. J. R. Astr. Soc. 71, 629–646.<br />
Ooe M., 1978, An optimal complex AR.MA model <strong>of</strong><br />
<strong>the</strong> <strong>Chandler</strong> <strong>wobble</strong>. Geophys. J. R. astr. Soc.<br />
(1978) 53, 445–457.<br />
Orms<strong>by</strong> J.F.A., 1961, Design <strong>of</strong> Numerical Filters<br />
with Application to Missile Data Processing, J.<br />
Assoc. Compt. Mach., 8, 440–466.<br />
Plag H.-P., 1997, <strong>Chandler</strong> <strong>wobble</strong> and pole tide in<br />
relation to inter<strong>annual</strong> atmosphere-ocean dynamics,<br />
in Tidal Phenomena Lecture Notes in Earth<br />
Sciences, 66, H. Wilhelm, W. Zurn and H.-G.<br />
Wenzel (eds.) 183–216.<br />
Ponte R.M., Stammer D. and Marshall J., 1998,<br />
Oceanic signals in observed motions <strong>of</strong> <strong>the</strong> Earth’s<br />
pole <strong>of</strong> rotation., Nature, Vol. 391/29 January<br />
1998, 476–479.<br />
Popiński W. and Kosek W., 2000, Comparison <strong>of</strong><br />
various spectro-temporal coherence functions between<br />
polar motion and atmospheric excitation<br />
functions, Artificial Satellites, Vol. 35, No. 4,<br />
191–207.<br />
Popiński W., Kosek W., Schuh H. and Schmidt M.,<br />
2002, Comparison <strong>of</strong> <strong>the</strong> two wavelet transform<br />
coherence and cross-covariance functions applied<br />
on polar motion and atmospheric excitation, Studia<br />
geophysica et geodetica, 45, (2002), 455–468.<br />
Rochester M.G. and Smylie D.E., 1965, Geomagnetic<br />
Core-Mantle Coupling and <strong>the</strong> <strong>Chandler</strong> Wobble.,<br />
Geophys. J.R. astr. Soc. (1965) 10, 289–315.<br />
Salstein D.A., D.M. Kann, A.J. Miller, R.D. Rosen<br />
1986, The Sub-bureau for Atmospheric Angular<br />
Momentum <strong>of</strong> <strong>the</strong> International Earth Rotation<br />
Service: A Meteorological Data Center with<br />
Geodetic Applications, Bull. Amer. Meteor.<br />
Soc., 74, 67–80.<br />
Schuh H., Nagel S. and Seitz T., 2001, Linear Drift<br />
and Periodic Variations Observed in Long Time<br />
Series <strong>of</strong> Polar Motion. Journal <strong>of</strong> Geodesy, 74,<br />
701–710.<br />
Schmitz-Hübsch, H., Schuh, H., 1999, Seasonal and<br />
Short-Period Fluctuations <strong>of</strong> Earth Rotation Investigated<br />
<strong>by</strong> Wavelet Analysis. Festschrift for<br />
Erik W. Grafarend, Universitt Stuttgart, Techn.<br />
Rep. Dep. <strong>of</strong> Geodesy and Geoinformatics, Report<br />
Nr. 1999.6-2, 421-431.<br />
Souriau A. and Cazenave A., 1985, Reevaluation <strong>of</strong><br />
<strong>the</strong> <strong>Chandler</strong> <strong>wobble</strong> seismic excitation from recent<br />
data., Earth and Planetary Science Letters,<br />
75, 410–416.<br />
Vicente, R.O. and Wilson C.R.,1997, On <strong>the</strong> variability<br />
<strong>of</strong> <strong>the</strong> <strong>Chandler</strong> frequency, Journ. Geophys.<br />
Res., Vol. 102, No B9, 20439–20445.<br />
Vondrak J., 1985, Long period behaviour <strong>of</strong> polar<br />
motion between 1900.0 and 1984.0, Annales Geophysicae,<br />
3, 3, 351–356.<br />
Wilson C.R. and Haubrich R.A. 1976, Meteorological<br />
<strong>Excitation</strong> <strong>of</strong> <strong>the</strong> Earth’s Wobble, Geophys. J. R.<br />
Astron. Soc. 46, 707–743.