OHS Performance Measurement in the Construction Industry
OHS Performance Measurement in the Construction Industry
OHS Performance Measurement in the Construction Industry

You also want an ePaper? Increase the reach of your titles
YUMPU automatically turns print PDFs into web optimized ePapers that Google loves.
It should be noted that not all work-related deaths <strong>in</strong>volve a workers’<br />
compensation payment be<strong>in</strong>g made. For <strong>in</strong>stance, where <strong>the</strong> worker may be selfemployed<br />
or if <strong>the</strong> worker has no dependents to make a compensation claim,<br />
payment will usually not be made. The most recent national work-related fatality<br />
study showed that 30% of work-related traumatic deaths <strong>in</strong> <strong>the</strong> construction<br />
<strong>in</strong>dustry did not receive workers’ compensation (N<strong>OHS</strong>C, 1999).<br />
Work-related traumatic fatalities <strong>in</strong> Australia 1989-1992<br />
Information regard<strong>in</strong>g work-related traumatic fatalities of workers employed <strong>in</strong> <strong>the</strong><br />
construction <strong>in</strong>dustry dur<strong>in</strong>g both 1982 to 1984 (Harrison et al, 1989) and dur<strong>in</strong>g<br />
1989 to 1992 (N<strong>OHS</strong>C, 1998b) was obta<strong>in</strong>ed from <strong>in</strong>vestigations of coronial files.<br />
A detailed exam<strong>in</strong>ation of fatalities <strong>in</strong> <strong>the</strong> construction <strong>in</strong>dustry dur<strong>in</strong>g 1989 to<br />
1992 is available <strong>in</strong> Work-related traumatic fatalities <strong>in</strong>volv<strong>in</strong>g construction<br />
activities <strong>in</strong> Australia, 1989 to 1992 (N<strong>OHS</strong>C, 1999).<br />
Dur<strong>in</strong>g 1989 to 1992, <strong>the</strong>re were 256 persons who were fatally <strong>in</strong>jured as a result of<br />
construction activities <strong>in</strong> Australia. Of <strong>the</strong>se 256 persons, 232 were workers who<br />
were employed <strong>in</strong> <strong>the</strong> construction <strong>in</strong>dustry, 18 were persons who were work<strong>in</strong>g,<br />
but who were not employed <strong>in</strong> <strong>the</strong> construction <strong>in</strong>dustry, but were fatally <strong>in</strong>jured<br />
on a construction site and six were persons who were fatally <strong>in</strong>jured as bystanders<br />
to construction work.<br />
Workers who were employed <strong>in</strong> <strong>the</strong> construction <strong>in</strong>dustry (exclud<strong>in</strong>g commut<strong>in</strong>g<br />
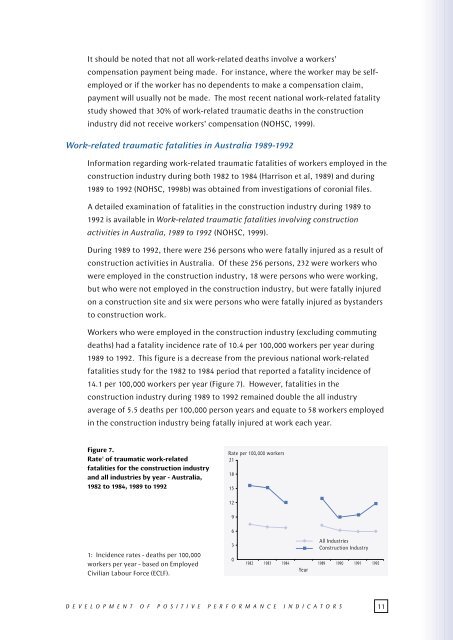
deaths) had a fatality <strong>in</strong>cidence rate of 10.4 per 100,000 workers per year dur<strong>in</strong>g<br />
1989 to 1992. This figure is a decrease from <strong>the</strong> previous national work-related<br />
fatalities study for <strong>the</strong> 1982 to 1984 period that reported a fatality <strong>in</strong>cidence of<br />
14.1 per 100,000 workers per year (Figure 7). However, fatalities <strong>in</strong> <strong>the</strong><br />
construction <strong>in</strong>dustry dur<strong>in</strong>g 1989 to 1992 rema<strong>in</strong>ed double <strong>the</strong> all <strong>in</strong>dustry<br />
average of 5.5 deaths per 100,000 person years and equate to 58 workers employed<br />
<strong>in</strong> <strong>the</strong> construction <strong>in</strong>dustry be<strong>in</strong>g fatally <strong>in</strong>jured at work each year.<br />
Figure 7.<br />
Rate 1 of traumatic work-related<br />
fatalities for <strong>the</strong> construction <strong>in</strong>dustry<br />
and all <strong>in</strong>dustries by year - Australia,<br />
1982 to 1984, 1989 to 1992<br />
Rate per 100,000 workers<br />
21<br />
18<br />
15<br />
1: Incidence rates - deaths per 100,000<br />
workers per year - based on Employed<br />
Civilian Labour Force (ECLF).<br />
12<br />
9<br />
6<br />
3<br />
0<br />
All Industries<br />
<strong>Construction</strong> <strong>Industry</strong><br />
1982 1983 1984 1989 1990 1991 1992<br />
Year<br />
DEVELOPMENT OF POSITIVE PERFORMANCE INDICATORS 11