Homework #1 (due September 14th, 2012) EconS 330
Homework #1 (due September 14th, 2012) EconS 330
Homework #1 (due September 14th, 2012) EconS 330

You also want an ePaper? Increase the reach of your titles
YUMPU automatically turns print PDFs into web optimized ePapers that Google loves.
<strong>Homework</strong> <strong>#1</strong> (<strong>due</strong> <strong>September</strong> <strong>14th</strong>, <strong>2012</strong>) <strong>EconS</strong> <strong>330</strong><br />
Instructor: Ana Espinola, Hulbert 111C, anaespinola@wsu.edu<br />
Office hours: Tuesdays 9.00 – 10.00am, or by appointment.<br />
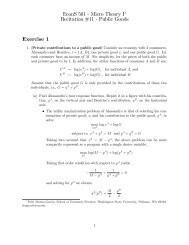
Question <strong>#1</strong> (15 Points)<br />
A coral reef area will either be protected or mined. A set of costs and benefits is given for<br />
a 10-year period. Find the Net Present Value for an interest rate of 5% and 10%.<br />
Problem Set 1. Discount rates<br />
Project 1. Pullman Marine Park<br />
Years<br />
0 1 2 3 4 5<br />
Costs (thousands of $)<br />
Construction 1250<br />
Recurring costs 150 200 150 100 100<br />
Foregone recreation 50 50 50 50 50 50<br />
Benefits<br />
Increased tourist revenue 500 700 800 900 900 900<br />
Net -800 500 550 700 750 750<br />
NPV @ 5% [1984.41] -800 476.19 498.87 604.69 617.03 587.64<br />
NPV @ 10% [1612.96] -800 454.55 454.55 525.92 512.26 465.69<br />
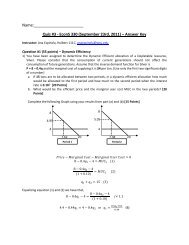
Question #2 (15 Points)<br />
Let’s assume that we are interested in the preservation of a river. Therefore, static efficiency requires us<br />
to ask: What is the efficient number of miles preserved Use the graph to answer this question<br />
Price<br />
Net Benefit when q=27.5<br />
700<br />
Marginal<br />
Cost<br />
600<br />
Marginal Cost = Demand<br />
550<br />
500<br />
Demand<br />
0<br />
20.6 27.5 31.55<br />
55<br />
Quantity<br />
1
Find the net benefit when (Please show your calculations: if you do the problems by hand or calculator,<br />
show your intermediate formulas):<br />
a. Quantity is 27.5<br />
b. Quantity is 31.55<br />
c. Quantity is 20.6<br />
Question #3 (15 Points)<br />
Are the following statements true or false Explain why<br />
a. If your consumption of cigarettes produces negative externalities for your partner (which you<br />
ignore), then you are consuming more cigarettes than is Pareto efficient.<br />
TRUE. With negative externalities the market equilibrium quantity in general exceeds the Paretoefficient<br />
level.<br />
b. It is generally efficient to set an emission standard allowing zero pollution<br />
FALSE. If some production process generates a nonzero level of pollution, but the benefits exceed<br />
the cost. Then this production is socially optimal and should be allowed. Hence the emission<br />
standards should allow for a certain nonzero pollution level.<br />
c. A tax on cigarettes induces the market for cigarettes to perform more efficiently<br />
TRUE. Smoking generates negative externalities, and the market outcome is efficient.<br />
d. A ban on smoking is necessarily efficient.<br />
FALSE. A ban on smoking reduces the utility of the smokers and the profits of the cigarette<br />
makers. The utility of nonsmokers and the profits of the producers of substitute goods (chewing<br />
tobacco) will increase. The effect on aggregate welfare function is the sum of these offsetting<br />
effects and may be positive or negative.<br />
2
Question #4 (20 Points)<br />
One convenient way to express the TWP relationship between price and quantity is to use the inverse<br />
demand function. In an inverse demand function, the price consumers are willing to pay is expressed as<br />
a function of the quantity available for sale.<br />
Suppose the inverse demand function of a product is P= 100 - .5q, and the marginal cost of producing it<br />
is MC = q+10, where P is the price of the good and q is the quantity demanded and/or supplied.<br />
a. Draw a graph showing the demand curve and the marginal cost curve.<br />
b. How much would be supplied in a static efficient allocation (Illustrate the quantity on your<br />
graph)<br />
c. What would be the magnitude of the net benefits (Illustrate the net benefits on your graph)<br />
a. Graph<br />
Price<br />
100<br />
Marginal<br />
Cost<br />
Marginal Cost = Demand<br />
70<br />
10<br />
Demand<br />
60<br />
200<br />
Quantity<br />
b. The static efficient allocation is when MC=D<br />
P=MC<br />
100 – .5q = q + 10<br />
-1.5q = -90<br />
q = 60<br />
c. The magnitude of the benefit is:<br />
3
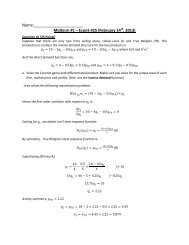
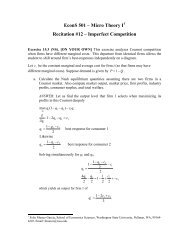
Question #5 (35 Points)<br />
Consider a variation of the chemical manufacturing example. Suppose the inverse demand curve for the<br />
chemical (which is also a marginal benefit curve) is Pd = 24 – Q, where Q is the quantity consumed (in<br />
millions of tons per year) when the price consumer pay is Pd (in dollars per ton).<br />
The inverse supply curve (also the marginal private cost curve) is MPC = 2 + Q, where MPC is the<br />
marginal private cost when the industry produces Q.<br />
The industry emits one unit of pollutant for each ton of chemical it produces. As long as there are fewer<br />
than 2 million units of pollutant emitted each year, the external cost is zero. But when the pollutant<br />
exceeds 2 million units, the marginal cost is positive. The marginal external cost is:<br />
MEC =<br />
where MEC is marginal external cost in dollars per unit of pollutant when Q units of pollutant are<br />
released.<br />
Also supposed the government wants to use an emissions fee of $6 per unit of emissions to induce the<br />
market to produce the economically efficient amount of chemical.<br />
a. Draw a graph showing the demand curve, the MPC and the MEC.<br />
b. Construct a table comparing the equilibria with and without the emission fee.<br />
c. Explain why the following sum is the same with and without the fee: consumers surplus +private<br />
producer surplus-external cost + government receipts from the fee + deadweight loss<br />
Price<br />
MSC<br />
24<br />
22<br />
=(9x3)/2<br />
MPC<br />
MEC<br />
16<br />
TAX<br />
13<br />
10<br />
9<br />
6<br />
4<br />
2<br />
Demand<br />
2<br />
8<br />
11<br />
24<br />
Quantity<br />
-2<br />
4
) Without Tax Tax<br />
CS (24-13)X11/2=60.5 (24-16)X8/2=32<br />
PS (13-2)X11/2=60.5 (10-2)X8/2=32<br />
CE (11-2)X9/2=40.5 (8-2)X6/2=18<br />
GTR - (16-10)X8=48<br />
DWL 13.5 0<br />
P = MPC<br />
24 – Q = 2 +Q<br />
-2Q = -22<br />
Q = 11<br />
If Q = 11 then the price (using demand curve) is: P= 24 – 11 = 13<br />
The social Optimal quantity is : P = MSC. Therefore we need to identify the MSC curve:<br />
MSC = MEC + MPC<br />
= [2 + Q] + [-2+Q]<br />
MSC = 2Q<br />
24 – Q = 2Q<br />
-3Q = -24<br />
Q = 8<br />
Substituting Q=8 into the demand function we have that P=16 (24-8)<br />
Finally, when the quantity produced is 8 then the MPC is (substituting 8 into MPC equation):<br />
MPC = 2 + 8 = 10<br />
Notice that DWL (without taxes): (9X3)/2=13.5<br />
c) consumers surplus +private producer surplus-external cost + government receipts from the fee + deadweight<br />
loss.<br />
Case without Tax: 60.5 + 60.5 -40.50 +0 +13.5=94<br />
Case with Tax: 32 + 32 - 18 + 48 =94<br />
These results can be explained by the DWL and the fact that the government internalizes the negative externalities<br />
through the emission fee. The emission fee eliminates the DWL, reduces the cost of externalities and increases the<br />
government revenues.<br />
Notation:<br />
CS = Consumer Surplus, PS = Producer surplus, MPC= Marginal Private Cost, MSC= Marginal Social Cost, CE= Cost of Externality, GTR =<br />
Government Revenue from Taxes, NSB= Net Social Benefit, DWL= Deadweight lost, MEC= Marginal External Cost<br />
5