Forecasters Guide - (IMD), Pune
Forecasters Guide - (IMD), Pune
Forecasters Guide - (IMD), Pune
You also want an ePaper? Increase the reach of your titles
YUMPU automatically turns print PDFs into web optimized ePapers that Google loves.
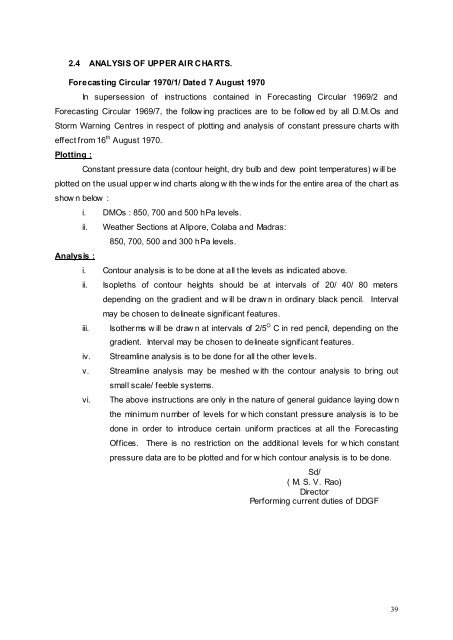
2.4 ANALYSIS OF UPPER AIR CHARTS.<br />
Forecasting Circular 1970/1/ Dated 7 August 1970<br />
In supersession of instructions contained in Forecasting Circular 1969/2 and<br />
Forecasting Circular 1969/7, the follow ing practices are to be follow ed by all D.M.Os and<br />
Storm Warning Centres in respect of plotting and analysis of constant pressure charts with<br />
effect from 16 th August 1970.<br />
Plotting :<br />
Constant pressure data (contour height, dry bulb and dew point temperatures) w ill be<br />
plotted on the usual upper w ind charts along w ith the w inds for the entire area of the chart as<br />
show n below :<br />
i. DMOs : 850, 700 and 500 hPa levels.<br />
ii.<br />
Analysis :<br />
Weather Sections at Alipore, Colaba and Madras:<br />
850, 700, 500 and 300 hPa levels.<br />
i. Contour analysis is to be done at all the levels as indicated above.<br />
ii.<br />
iii.<br />
iv.<br />
Isopleths of contour heights should be at intervals of 20/ 40/ 80 meters<br />
depending on the gradient and w ill be draw n in ordinary black pencil. Interval<br />
may be chosen to delineate significant features.<br />
Isotherms w ill be draw n at intervals of 2/5 O C in red pencil, depending on the<br />
gradient. Interval may be chosen to delineate significant features.<br />
Streamline analysis is to be done for all the other levels.<br />
v. Streamline analysis may be meshed w ith the contour analysis to bring out<br />
vi.<br />
small scale/ feeble systems.<br />
The above instructions are only in the nature of general guidance laying dow n<br />
the minimum number of levels for w hich constant pressure analysis is to be<br />
done in order to introduce certain uniform practices at all the Forecasting<br />
Offices. There is no restriction on the additional levels for w hich constant<br />
pressure data are to be plotted and for w hich contour analysis is to be done.<br />
Sd/<br />
( M. S. V. Rao)<br />
Director<br />
Performing current duties of DDGF<br />
39


