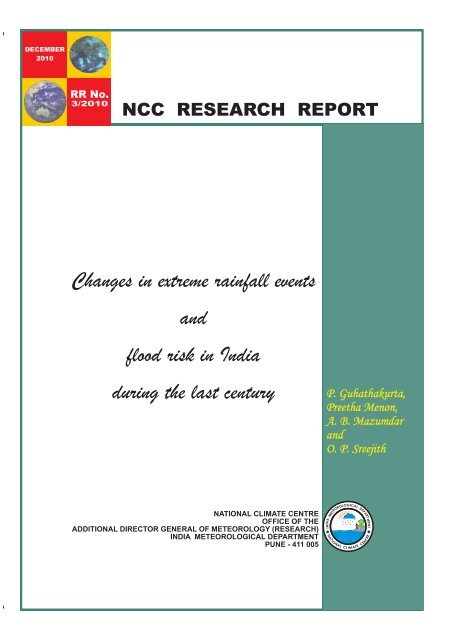
Changes in extreme rainfall events and flood risk in ... - (IMD), Pune
Changes in extreme rainfall events and flood risk in ... - (IMD), Pune
Changes in extreme rainfall events and flood risk in ... - (IMD), Pune

You also want an ePaper? Increase the reach of your titles
YUMPU automatically turns print PDFs into web optimized ePapers that Google loves.
National Climate CentreResearch Report No: 3/2010<strong>Changes</strong> <strong>in</strong> <strong>extreme</strong> ra<strong>in</strong>fall <strong>events</strong> <strong>and</strong> <strong>flood</strong> <strong>risk</strong> <strong>in</strong>India dur<strong>in</strong>g the last centuryP. Guhathakurta, Preetha Menon, A. B. Mazumdar<strong>and</strong> O. P. SreejithNational Climate CentreIndia Meteorological DepartmentPUNE. INDIA411005ncc@imdpune.gov.<strong>in</strong>
Executive Summary1 Document title <strong>Changes</strong> <strong>in</strong> <strong>extreme</strong> ra<strong>in</strong>fall <strong>events</strong> <strong>and</strong> <strong>flood</strong> <strong>risk</strong> <strong>in</strong> Indiadur<strong>in</strong>g the last century2 Document type Research Report3 Issue No. NCC Research Report No. 3/20104 Issue date 23 rd December, 20105 Security UnclassifiedClassification6 Control Status Unclassified7 No. of Pages 228 No. of Figures 129 No. of reference 1810 Distribution Unrestricted11 Language English12 Authors/ Editors P. Guhathakurta, Preetha Menon, A. B. Mazumdar <strong>and</strong>O. P. Sreejith13 Orig<strong>in</strong>at<strong>in</strong>g National Climate Centre, Office of ADGM (R), IndiaDivision/Group14 Review<strong>in</strong>g <strong>and</strong>Approv<strong>in</strong>gAuthorityMeteorological Department, <strong>Pune</strong>Additional Director General of Meteorology (Research),India Meteorological Department, <strong>Pune</strong>15 End users Disaster Managers, Hydrological planners <strong>and</strong>Researchers, Government Officials etc.16 Abstract The occurrences of some exceptionally very heavyra<strong>in</strong>fall dur<strong>in</strong>g the recent years <strong>and</strong> caus<strong>in</strong>g flash <strong>flood</strong>s<strong>in</strong> many areas forced to study the long term changes <strong>in</strong><strong>extreme</strong> ra<strong>in</strong>fall over India. The study <strong>in</strong>cludes theanalysis of the frequency of ra<strong>in</strong>y days, ra<strong>in</strong> days <strong>and</strong>heavy ra<strong>in</strong>fall days as well as one-day <strong>extreme</strong> ra<strong>in</strong>fall<strong>and</strong> return period analysis <strong>in</strong> order to observe the impactof climate changes on Extreme weather <strong>events</strong> <strong>and</strong> <strong>flood</strong><strong>risk</strong> <strong>in</strong> India. The report will give some <strong>in</strong>terest<strong>in</strong>g f<strong>in</strong>d<strong>in</strong>gswhich are very useful for hydrological plann<strong>in</strong>g <strong>and</strong>disaster managements. It has been found that frequencyof heavy ra<strong>in</strong>fall <strong>events</strong> are decreas<strong>in</strong>g <strong>in</strong> major parts ofthe central <strong>and</strong> north India while <strong>in</strong>creas<strong>in</strong>g <strong>in</strong> thepen<strong>in</strong>sular India, east <strong>and</strong> north east India. Extremera<strong>in</strong>fall <strong>and</strong> <strong>flood</strong> <strong>risk</strong> is <strong>in</strong>creas<strong>in</strong>g significantlyparticularly <strong>in</strong> many regions of the country except someparts of central India.17 Key Words Extreme ra<strong>in</strong>fall, return period, climate change, <strong>flood</strong> <strong>risk</strong>2
1. IntroductionIn recent years, heavy precipitation <strong>events</strong> have resulted <strong>in</strong> several damag<strong>in</strong>g <strong>flood</strong>s<strong>in</strong> India. The consecutive flash <strong>flood</strong>s over three major metro cities <strong>in</strong> the same year i.e.Mumbai <strong>in</strong> July 2005, Chennai <strong>in</strong> October 2005 <strong>and</strong> aga<strong>in</strong> <strong>in</strong> December 2005 <strong>and</strong> Bangalore<strong>in</strong> October 2005 caused heavy damages <strong>in</strong> economy, loss of life etc. Some of the recentstudies ( Goswami et al, 2006 ; Rajeevan et al, 2008) on <strong>extreme</strong> ra<strong>in</strong>fall <strong>events</strong> over Indiawere mostly concentrated <strong>in</strong> central India. The regions where the country experiencedrecent <strong>extreme</strong> ra<strong>in</strong>fall <strong>events</strong> like 94.cm <strong>in</strong> Mumbai, 156.5 cm (country's highest everrecorded one day po<strong>in</strong>t ra<strong>in</strong>fall or the regions of Chennai or Bangalore were not <strong>in</strong>cluded <strong>in</strong>their study region. Therefore a detailed study on <strong>extreme</strong> weather <strong>events</strong> mostly ra<strong>in</strong>fall isurgently needed to have a clear idea about the impact of climate change on the <strong>extreme</strong>weather <strong>events</strong> of the country. It may be mentioned that the <strong>in</strong>formation on the changes on<strong>extreme</strong>s weather <strong>events</strong> is more important than the changes <strong>in</strong> mean pattern for the betterdisaster management <strong>and</strong> mitigation. Accord<strong>in</strong>g to the latest report of IntergovernmentalPanel on Climate Change (IPCC, 2007) another aspect of these projected changes is that“wet <strong>extreme</strong>s are projected to become more severe <strong>in</strong> many areas where meanprecipitation is expected to <strong>in</strong>crease, <strong>and</strong> dry <strong>extreme</strong>s are projected to become moresevere <strong>in</strong> areas where mean precipitation is projected to decrease. In the Asian monsoonregion <strong>and</strong> other tropical areas there will be more <strong>flood</strong><strong>in</strong>g”.A large amount of the variability of ra<strong>in</strong>fall is related to the occurrence of <strong>extreme</strong>ra<strong>in</strong>fall <strong>events</strong> <strong>and</strong> their <strong>in</strong>tensities. Therefore, there is a need to know the magnitudes of<strong>extreme</strong> ra<strong>in</strong>fall <strong>events</strong> over different parts of the area under study. The study of spatialvariability of <strong>extreme</strong> ra<strong>in</strong>fall <strong>events</strong> helps to identify the zone of high <strong>and</strong> low value of ever<strong>extreme</strong> ra<strong>in</strong>fall <strong>events</strong>. A detailed regionalized study is practically useful for the planners<strong>and</strong> other users. Earlier Rakhecha <strong>and</strong> Pisharoty (1996) have studied the heavy ra<strong>in</strong>fall<strong>events</strong> dur<strong>in</strong>g the southwest monsoon season for some selected stations over the country.Rakhecha <strong>and</strong> Soman, (1994) analyzed the annual <strong>extreme</strong> ra<strong>in</strong>fall series <strong>in</strong> the time scaleof 1 to 3 days duration at 316 stations, well distributed over the Indian region, cover<strong>in</strong>g 80-years of ra<strong>in</strong>fall data from 1901 to 1980 for trend <strong>and</strong> persistence us<strong>in</strong>g st<strong>and</strong>ard statisticaltests. They had reported that the annual <strong>extreme</strong> ra<strong>in</strong>fall records of most stations are freefrom trend <strong>and</strong> persistence. However, the <strong>extreme</strong> ra<strong>in</strong>fall series at stations over the westcoast north of 12°N <strong>and</strong> at some stations to the east of the Western Ghats over the centralparts of the Pen<strong>in</strong>sula showed a significant <strong>in</strong>creas<strong>in</strong>g trend at 95% level of confidence.Stations over the southern Pen<strong>in</strong>sula <strong>and</strong> over the lower Ganga valley have been found toexhibit a decreas<strong>in</strong>g trend at the same level of significance. Stephenson et al (1999) us<strong>in</strong>g1
the data for the period June to September 1986–89 have <strong>in</strong>vestigated <strong>extreme</strong> daily ra<strong>in</strong>fall<strong>events</strong> <strong>and</strong> their impact on ensemble forecasts of the Indian Monsoon. Most of the studieson <strong>extreme</strong> ra<strong>in</strong>fall over India (Sen Roy & Ball<strong>in</strong>g, 2004; Rakhecha <strong>and</strong> Soman, 1994) usedlimited number of stations. However their results are very useful for studies <strong>and</strong>management of disaster. Recently Goswami et al (2006) have studied the <strong>extreme</strong> ra<strong>in</strong>fallpattern of some selected area <strong>in</strong> central India us<strong>in</strong>g the daily gridded data of IndiaMeteorological Department for the period 1951-2003. In their study they have reported <strong>in</strong><strong>in</strong>crease <strong>in</strong> significant ris<strong>in</strong>g trends <strong>in</strong> the frequency <strong>and</strong> the magnitude of <strong>extreme</strong> ra<strong>in</strong><strong>events</strong> <strong>and</strong> a significant decreas<strong>in</strong>g trend <strong>in</strong> the frequency of moderate <strong>events</strong> over centralIndia. It may be noted that for <strong>extreme</strong> ra<strong>in</strong>fall analysis for study<strong>in</strong>g the behavior of changes<strong>in</strong> the <strong>extreme</strong> <strong>events</strong> us<strong>in</strong>g of real or actual station data is more realistic than the griddeddata as <strong>in</strong> the later case <strong>extreme</strong> <strong>events</strong> will be missed <strong>in</strong> most of the occasions due to<strong>in</strong>terpolation or averag<strong>in</strong>g scheme used <strong>in</strong> gridd<strong>in</strong>g. This even mislead regard<strong>in</strong>g the signalsof hydrological <strong>extreme</strong>s for better disaster management.The present study aims to analyze some of the <strong>extreme</strong> ra<strong>in</strong>fall <strong>in</strong>dices us<strong>in</strong>g reliable <strong>and</strong>consistent <strong>and</strong> sufficient number of ra<strong>in</strong>gauge station data, the changes <strong>in</strong> the frequency ofra<strong>in</strong>y days, ra<strong>in</strong> days as well as heavy ra<strong>in</strong>fall days. One-day <strong>extreme</strong> ra<strong>in</strong>fall analysis wasalso done to f<strong>in</strong>d out the changes <strong>in</strong> the <strong>in</strong>tensity of <strong>extreme</strong> weather <strong>events</strong>. Increas<strong>in</strong>g<strong>flood</strong> <strong>risk</strong> is now recognized as the most important sectoral threat from climate change <strong>in</strong>most parts of the world. Temporal variability <strong>in</strong> <strong>extreme</strong>s is analyzed <strong>in</strong> fixed decades from1951-60, 1961-1970, 1971-1980, 1981-1990 <strong>and</strong> 1991-2000, Return period analysis is usedto analyze the chang<strong>in</strong>g probability of <strong>extreme</strong> ra<strong>in</strong>fall <strong>events</strong> for observed data <strong>in</strong> order tof<strong>in</strong>d out the changes <strong>in</strong> <strong>flood</strong> <strong>risk</strong>.2. Data <strong>and</strong> methodologyDaily ra<strong>in</strong>fall data for the period 1901-2005 of more than 6000 ra<strong>in</strong>gauge stationsover India are considered <strong>in</strong>itially. The data is taken from the India MeteorologicalDepartment, <strong>Pune</strong>. From these network of stations 2599 stations are selected which arehav<strong>in</strong>g 30 years or more data. Annual time series of the follow<strong>in</strong>g <strong>in</strong>dices are constructed forthese stations.1. Frequency of ra<strong>in</strong>y days. A day is called ra<strong>in</strong>y day accord<strong>in</strong>g to IndiaMeteorological Department if the ra<strong>in</strong>fall of that is 2.5mm or more.2. Frequency of ra<strong>in</strong> days. A day is considered as ra<strong>in</strong> day if the amount ofra<strong>in</strong>fall of that day is 0.1mm or more.2
3. Frequency of heavy ra<strong>in</strong>fall days (<strong>in</strong>clud<strong>in</strong>g very heavy <strong>and</strong> <strong>extreme</strong>lyheavy). A day is called heavy ra<strong>in</strong>fall day accord<strong>in</strong>g to India MeteorologicalDepartment if the ra<strong>in</strong>fall of that is 64.5mm or more. This <strong>in</strong>cludes veryheavy ( i.e. 124.5mm to 244.5mm) <strong>and</strong> <strong>extreme</strong>ly heavy (i.e. greater than244.5mm ) ra<strong>in</strong>fall cases.4. Annual one day Extreme ra<strong>in</strong>fall seriesWhile analyz<strong>in</strong>g the data it has been found that there were some miss<strong>in</strong>g observations <strong>in</strong>some years of data. For all of these above three cases we have removed the effect ofmiss<strong>in</strong>g days observation by divid<strong>in</strong>g the actual annual frequency with actual number ofobservation of that year <strong>and</strong> then multiply<strong>in</strong>g by the number of days of that year.Recent studies <strong>in</strong>dicate that the most widely used method for detect<strong>in</strong>g the trend isthe non-parametric Mann-Kendall trend test. Mann (1945) orig<strong>in</strong>ally derived the test <strong>and</strong>Kendall (1975) subsequently derived the test statistic commonly known as the Kendall’s taustatistic. It was found to be an excellent tool for trend detection <strong>in</strong> different applications(Hirsch et al., 1982; Lettenmaier et al., 1994; Burn <strong>and</strong> Hag-Elnur, 2002).Under the null hypothesis H0, that a series {x 1 , …, x N } come from a population wherethe r<strong>and</strong>om variables are <strong>in</strong>dependent <strong>and</strong> identically distributed ( i.e. the null hypothesis isof no trend) the MK test statistic isSN − 1 Ni= 1 j=i+1= ∑∑sgn( x j− xi),wheresgn(x )=⎧ + 1,⎪⎨0,x⎪⎩ − 1,x> 0= 0x < 0And tau is estimated asτ =2SN(N −1)3
It may be mentioned that Mann-Kendall trend test is a Non-parametric testwhich allows miss<strong>in</strong>g data. It is not affected by gross data errors <strong>and</strong> outliers. However thistest can be used only as a yes/no test for the existence of slope.To f<strong>in</strong>d the amount of <strong>in</strong>crease or decrease <strong>in</strong> 100 years we have adopted leastsquare l<strong>in</strong>ear fit of the data. Advantage of l<strong>in</strong>ear regression is that it provides an estimate ofslope, confidence <strong>in</strong>terval, <strong>and</strong> quantifies goodness of fit. However it does not h<strong>and</strong>lemiss<strong>in</strong>g data <strong>and</strong> may be greatly affected by outliers <strong>and</strong> cyclic data. As mentioned earlier <strong>in</strong>our case we have removed the effect of miss<strong>in</strong>g days observation by divid<strong>in</strong>g the actualannual frequency with actual number of observation of that year <strong>and</strong> then multiply<strong>in</strong>g by thenumber of days of that year.To determ<strong>in</strong>e the <strong>flood</strong> <strong>risk</strong>, <strong>extreme</strong> values for 25, 50 <strong>and</strong> 100 years return periodare calculated. Probabilistic <strong>extreme</strong> value theory, which primarily deals with thestochastic behavior of the maximum <strong>and</strong> m<strong>in</strong>imum r<strong>and</strong>om variables, <strong>extreme</strong> <strong>and</strong><strong>in</strong>termediate order statistics <strong>and</strong> exceedance over (below) high (low) thresholds aredeterm<strong>in</strong>ed by the underly<strong>in</strong>g distribution.Traditionally, the three <strong>extreme</strong> value distributions are applied to annual maximumdaily ra<strong>in</strong>fall. In this paper we have used the generalized <strong>extreme</strong> value (GEV) distribution,which has all the flexibility of all the other <strong>extreme</strong> value distributions The GEV distributionwas developed by Jenk<strong>in</strong>son (1955), Hosk<strong>in</strong>g et al (1985) <strong>and</strong> Galambos (1987). Thecumulative distribution function (cdf) of the GEV distribution isx −ψF ( x;ψ , β)= exp( −(1+ ζ )βfor 1+ξ(x−ψ)/β > 0, where ψ, β <strong>and</strong> ξ are referred to as the location, scale <strong>and</strong> shapeparameters respectively. The particular case of (1) for ξ 0 is the Gumbel distributionF(x;ψ , β ) = e−e( ψ − x)/ β1The median is ψ − β ln(−ln( ))2−1/ζ)The mean is ψ + γβ where γ = Euler-Mascheroni constant 0.5772156649015328606.4
The st<strong>and</strong>ard deviation isThe mode is ψ.Then from the Gumbel distribution with parameters ψ <strong>and</strong> β the <strong>extreme</strong> value (return value)x for a period of n years can be written by the follow<strong>in</strong>g formula:x = ψ - β ln[-ln(F)]where ψ = average - γβ (where γ is Euler's constant, approximately 0.557)β = 0.78σ (where σ is the st<strong>and</strong>ard deviation)F is the r<strong>and</strong>om variate drawn from the uniform distribution <strong>in</strong> the <strong>in</strong>terval [0, 1] = (n-1)/n3. Result <strong>and</strong> AnalysisThe country be<strong>in</strong>g with<strong>in</strong> the tropical monsoon zone is hav<strong>in</strong>g high spatial variation <strong>in</strong>ra<strong>in</strong>fall <strong>and</strong> its frequencies. Fig 1a shows the location of 2599 ra<strong>in</strong>gauge stations over Indiawhich were considered for this study while Fig 1b gives the location of 36 meteorologicalsub-divisions of India. From the annual frequency of ra<strong>in</strong>y days, ra<strong>in</strong> days <strong>and</strong> heavy ra<strong>in</strong>falldays, average or normal ra<strong>in</strong>y days, ra<strong>in</strong> days <strong>and</strong> heavy ra<strong>in</strong>fall days were computed. Highspatial variations of climatology of frequency of ra<strong>in</strong>y days can be seen <strong>in</strong> Fig. 2. Annualnormal ra<strong>in</strong>y days varies from the low value of 10 over <strong>extreme</strong> western parts of Rajasthanto the high frequency of 130 days over north eastern parts of the country. The northeasternparts of the country as well as sub- Himalayan West Bengal <strong>and</strong> also <strong>extreme</strong> western coastl<strong>in</strong>e of the country received on an average more than 100 ra<strong>in</strong>y days <strong>in</strong> a year.Significant decreas<strong>in</strong>g trends <strong>in</strong> the frequency of Ra<strong>in</strong> days, ra<strong>in</strong>y days <strong>and</strong> heavyra<strong>in</strong>fall days are be<strong>in</strong>g noticed over most parts of central, north <strong>and</strong> eastern parts of thecountry us<strong>in</strong>g both Mann-Kendall <strong>and</strong> t tests. Fig. 3 a <strong>and</strong> Fig. 3 b show thedecreas<strong>in</strong>g/<strong>in</strong>creas<strong>in</strong>g trend of stations hav<strong>in</strong>g significant at 95% <strong>and</strong> 99% respectively <strong>in</strong> thefrequency of ra<strong>in</strong> days obta<strong>in</strong>ed by us<strong>in</strong>g Mann-Kendall test. Wet days have been <strong>in</strong>creased<strong>in</strong> pen<strong>in</strong>sular India particularly over Karnataka, Andhra Pradesh <strong>and</strong> parts of Rajasthan <strong>and</strong>some parts of eastern India while most of parts of central <strong>and</strong> northern India are hav<strong>in</strong>gdecreas<strong>in</strong>g trends <strong>in</strong> frequency of ra<strong>in</strong> days. Fig. 4 a <strong>and</strong> Fig. 4 b show thedecreas<strong>in</strong>g/<strong>in</strong>creas<strong>in</strong>g trend of stations hav<strong>in</strong>g significant at 95% <strong>and</strong> 99% respectively <strong>in</strong> the5
frequency of ra<strong>in</strong>y days obta<strong>in</strong>ed by us<strong>in</strong>g Mann-Kendall test. Fig. 5 a <strong>and</strong> Fig. 5 b show thedecreas<strong>in</strong>g/<strong>in</strong>creas<strong>in</strong>g trend of stations hav<strong>in</strong>g significant at 95% <strong>and</strong> 99% respectively <strong>in</strong> thefrequency of heavy ra<strong>in</strong>fall days obta<strong>in</strong>ed by us<strong>in</strong>g Mann-Kendall test. Almost similarpatterns of trends that have been observed <strong>in</strong> frequency of ra<strong>in</strong> days <strong>in</strong> Fig 3 are also be<strong>in</strong>gobserved <strong>in</strong> the frequency of ra<strong>in</strong>y days <strong>in</strong> Fig 4. However the <strong>in</strong>creas<strong>in</strong>g trends <strong>in</strong> frequencyof heavy ra<strong>in</strong>fall days are be<strong>in</strong>g observed over very few numbers of stations mostly <strong>in</strong>Konkan & Goa <strong>and</strong> adjo<strong>in</strong><strong>in</strong>g regions of western coast <strong>and</strong> some isolated stations of easternIndia. Frequency of heavy ra<strong>in</strong>fall <strong>events</strong> decreased significantly for most parts of thecountry. Fig. 6 is obta<strong>in</strong>ed by do<strong>in</strong>g the contour analysis on the rate of decrease/<strong>in</strong>crease i.e.slopes <strong>in</strong> 100 years for the significant values at 95% level obta<strong>in</strong>ed by us<strong>in</strong>g l<strong>in</strong>earregression. The rate of <strong>in</strong>crease <strong>in</strong> ra<strong>in</strong> days has been observed to be around 40 to 50 days<strong>in</strong> 100 years <strong>in</strong> pen<strong>in</strong>sular India particularly over Karnataka, Andhra Pradesh. Increased <strong>in</strong>ra<strong>in</strong> days has also been observed over most parts of Rajasthan, parts of Gangetic WestBengal <strong>and</strong> adjo<strong>in</strong><strong>in</strong>g parts of Jharkh<strong>and</strong>. These <strong>in</strong>dicate that the great desert areas of Indiaare becom<strong>in</strong>g wet. It may be mentioned that Guhathakurta <strong>and</strong> Rajeevan(2008) <strong>in</strong> theirstudy have reported the <strong>in</strong>creas<strong>in</strong>g trend <strong>in</strong> annual mean ra<strong>in</strong>fall of these regions. However<strong>extreme</strong> southern parts of the country i.e. Kerala <strong>and</strong> Tamilnadu gett<strong>in</strong>g more dry days.Decreas<strong>in</strong>g trends <strong>in</strong> annual mean ra<strong>in</strong>fall over Kerala <strong>and</strong> Tamilnadu have also beenreported by Guhathakurta <strong>and</strong> Rajeevan (2008). Fig. 6c clearly <strong>in</strong>dicates that frequency of<strong>extreme</strong> ra<strong>in</strong>fall <strong>events</strong> have been decreased most of the central <strong>and</strong> north India. It may bementioned that Goswami et al (2006) reported the significant <strong>in</strong>creas<strong>in</strong>g trends <strong>in</strong> thefrequency of <strong>extreme</strong> <strong>events</strong> over central India us<strong>in</strong>g gridded data. This type of false<strong>in</strong>dication naturally happens while study<strong>in</strong>g <strong>extreme</strong> ra<strong>in</strong>fall with gridded data set. Maximum<strong>in</strong>crease <strong>in</strong> the frequency of heavy ra<strong>in</strong>fall <strong>events</strong> (20 to 50 days <strong>in</strong> 100 years) has beennoticed <strong>in</strong> north east India.Fig. 7 gives the spatial pattern of the India’s highest 1-day ever recorded po<strong>in</strong>tra<strong>in</strong>fall. Occurrences of 40 cm or more ra<strong>in</strong>fall are be<strong>in</strong>g noticed along the west <strong>and</strong> eastcost of India, Gangetic West Bengal <strong>and</strong> north eastern parts of India. Table 1 gives theoccurrence of 90 cm or more ra<strong>in</strong>fall <strong>in</strong> one day (24 hrs) <strong>in</strong> India. There were 18 cases ofoccurrence of more than 90 cm ra<strong>in</strong>fall <strong>in</strong> one day <strong>and</strong> out of these 11 cases were happeneds<strong>in</strong>ce 1970. Out of four occurrences of more than 100 cm ra<strong>in</strong>fall <strong>in</strong> one day, two occurreddur<strong>in</strong>g the recent decade 2001-2010. The occurrence of 156.3 cm <strong>in</strong> one day <strong>in</strong> Cherrapunjion 15 th June 1995 is India’s highest ever recorded one day po<strong>in</strong>t ra<strong>in</strong>fall <strong>and</strong> also theconsecutive two days ra<strong>in</strong>fall of 249.3cm of ra<strong>in</strong>fall on 14-15th June 1995 is now the world’shighest 2-day po<strong>in</strong>t ra<strong>in</strong>fall (Guhathakurta,2007).6
Trend analysis was performed over annual one-day <strong>extreme</strong> ra<strong>in</strong>fall series for eachof the station. Fig. 8 a <strong>and</strong> Fig. 8 b show the <strong>in</strong>creas<strong>in</strong>g/ decreas<strong>in</strong>g trend of stations hav<strong>in</strong>gsignificant at 95% <strong>and</strong> 99% respectively <strong>in</strong> the one-day <strong>extreme</strong> ra<strong>in</strong>fall obta<strong>in</strong>ed by us<strong>in</strong>gMann-Kendall test. The nonparametric test shows significant <strong>in</strong>creas<strong>in</strong>g trend <strong>in</strong> one-day<strong>extreme</strong> ra<strong>in</strong>fall over the south pen<strong>in</strong>sular region, Maharashtra, Gujarat region, Bihar <strong>and</strong>some other isolated areas. The parametric test us<strong>in</strong>g l<strong>in</strong>ear regression helps to f<strong>in</strong>d out therate of <strong>in</strong>crease <strong>in</strong> 100 years <strong>and</strong> these are shown <strong>in</strong> Fig.9. Significant decrease both <strong>in</strong><strong>in</strong>tensity <strong>and</strong> frequency of <strong>extreme</strong> ra<strong>in</strong>fall have been observed over Chattisgarh, Jharkh<strong>and</strong><strong>and</strong> some parts of north India.The <strong>extreme</strong> values for 25 return periods showed large variation (Fig. 10). The 25year return period values varied from 10 cm over Rajasthan, parts of north Interior Karnataka<strong>and</strong> Marathwada to 30 cm over West Bengal, Orissa <strong>and</strong> parts of north east India. To f<strong>in</strong>dthe change <strong>in</strong> <strong>flood</strong> <strong>risk</strong> we have studied the decadal variability of 25 year return period.Temporal variability <strong>in</strong> <strong>extreme</strong>s has also been analyzed <strong>in</strong> fixed decades from 1961-1970,1971-1980, 1981-1990 <strong>and</strong> 1991-2000 earlier by Fowler <strong>and</strong> Kilsby( 2003) for<strong>in</strong>vestigat<strong>in</strong>g the <strong>flood</strong> <strong>risk</strong> over United K<strong>in</strong>gdom though large uncerta<strong>in</strong>ty prevails alongwith the change of time. Fig. 11 shows the decadal variability of <strong>extreme</strong> values (cm) for 25years return period for the decades 1951-60, 1961-70, 1971-80, 1981-90 <strong>and</strong> 1991-2000. Inthe decades 1991-2000 the probability of occurrence of <strong>extreme</strong> values of more than 25 cmor more were located along northern parts of west coast, throughout the eastern coast, WestBengal <strong>and</strong> Gujarat regions. Fig 12 br<strong>in</strong>gs out the percentage frequencies of <strong>extreme</strong>values (cm) for 25 years return period <strong>in</strong> different range for each of the decade.Percentage frequencies for different ranges are calculated from the decadal returnvalues of all the 2249 ra<strong>in</strong> gauge stations. It is clear that frequency of <strong>extreme</strong> valuesgreater than 30 cm were more <strong>in</strong> the recent two decades viz. 1981-90 <strong>and</strong> 1991-2000. The evidence of <strong>in</strong>crease <strong>in</strong> <strong>flood</strong> <strong>risk</strong> dur<strong>in</strong>g the recent decades is clearly noticed.4. ConclusionsThe study br<strong>in</strong>gs noticeable changes <strong>in</strong> the <strong>extreme</strong> ra<strong>in</strong>fall <strong>events</strong> that happened <strong>in</strong>the past century over India. The country experienced large spatial variations <strong>in</strong> annualnormal ra<strong>in</strong>y days. Annual normal ra<strong>in</strong>y days varied from 10 over <strong>extreme</strong> western parts ofRajasthan to the high frequency of 130 days over north eastern parts of the country. Bothnon parametric test <strong>and</strong> l<strong>in</strong>ear trend analysis identified decreas<strong>in</strong>g trends <strong>in</strong> the frequency ofwet days <strong>in</strong> most parts of the country. Trend analysis of frequency of ra<strong>in</strong> days, ra<strong>in</strong>y days7
<strong>and</strong> heavy ra<strong>in</strong>fall days shows significant decreas<strong>in</strong>g trends over central <strong>and</strong> many parts ofnorth India while <strong>in</strong>creas<strong>in</strong>g trends over pen<strong>in</strong>sular India. Also the great desert areas of thecountry have experienced <strong>in</strong>crease number of wet days. Analysis of one-day <strong>extreme</strong>ra<strong>in</strong>fall series has shown that the <strong>in</strong>tensity of <strong>extreme</strong> ra<strong>in</strong>fall has been <strong>in</strong>creased overCoastal Andhra Pradesh <strong>and</strong> adjo<strong>in</strong><strong>in</strong>g areas, Saurashtra <strong>and</strong> Kutch, Orissa, West Bengal,parts of northeast India, east Rajasthan. Significant decrease both <strong>in</strong> <strong>in</strong>tensity <strong>and</strong> frequencyof <strong>extreme</strong> ra<strong>in</strong>fall have been observed over Chattisgarh, Jharkh<strong>and</strong> <strong>and</strong> some parts of northIndia. The <strong>flood</strong> <strong>risk</strong> also <strong>in</strong>creased significantly over India. The <strong>flood</strong> <strong>risk</strong> was more <strong>in</strong> thedecades 1981-90, 1971-80 <strong>and</strong> 1991-2000.To observe the compatibility of this changes with the climate model simulation wemay see the climate change scenarios projected by us<strong>in</strong>g the second generation HadleyCentre Regional Model (HadRM2) <strong>and</strong> the IS92a future scenarios of <strong>in</strong>creased GHGconcentrations (IPCC,2007). The projections <strong>in</strong>dicate that above 25°N latitude, the maximumtemperature may rise by 2-4°C dur<strong>in</strong>g the 2050s <strong>and</strong> <strong>in</strong> the northern region the <strong>in</strong>crease <strong>in</strong>maximum temperature may exceed 4°C. The m<strong>in</strong>imum temperature <strong>in</strong> the 2050s is expectedto rise by 4°C all over India, with a further rise <strong>in</strong> temperature <strong>in</strong> the southern pen<strong>in</strong>sula. Atan all-India level, little change <strong>in</strong> monsoon ra<strong>in</strong>fall is projected up to the 2050s. There is anoverall decrease <strong>in</strong> the number of ra<strong>in</strong>y days over a major part of the country. This decreaseis greater <strong>in</strong> the western <strong>and</strong> central parts by more than 15 days. The decreases <strong>in</strong> thenumber of ra<strong>in</strong>y days over major parts of the country are also be<strong>in</strong>g observed <strong>in</strong> this study.However <strong>in</strong> the present case for the first time the analysis of frequency of wet days <strong>and</strong> the<strong>in</strong>tensity of <strong>extreme</strong> ra<strong>in</strong>fall was done by us<strong>in</strong>g maximum network of observ<strong>in</strong>g stations. Thishelps to br<strong>in</strong>g out the smaller scales observed changes <strong>in</strong> frequency <strong>and</strong> <strong>in</strong>tensity of ra<strong>in</strong>fall.AcknowledgmentsThe authors express their s<strong>in</strong>cere thanks to Dr. Ajit Tyagi, DGM India MeteorologicalDepartment (<strong>IMD</strong>) for his guidance, encouragement <strong>and</strong> support <strong>in</strong> carry<strong>in</strong>g out this researchwork. Also we acknowledge the team of Hydrology unit, <strong>Pune</strong> for check<strong>in</strong>g <strong>and</strong> verify<strong>in</strong>g the<strong>extreme</strong> values with the orig<strong>in</strong>al manuscript dur<strong>in</strong>g the process<strong>in</strong>g of the data.8
ReferencesBurn, DH, Hag-Elnur MA (2002) Detection of hydrologic trend <strong>and</strong> variability, Journal ofHydrology, 255, 107-122.Fowler, H.J. <strong>and</strong> Kilsby, C.G. (2003). A regional frequency analysis of United K<strong>in</strong>gdom<strong>extreme</strong> ra<strong>in</strong>fall from 1961 to 2000. International Journal of Climatology, 23, 1313-1334.Galambos J (1987) The Asymptotic Theory of Extreme Order Statistics, 2nd edn. (Melbourne,Florida: Krieger).Goswami, BN, Venugopal V, Sengupta D,. Madhusoodanan MS, Xavier PK (2006) Increas<strong>in</strong>gTrend of Extreme Ra<strong>in</strong> Events Over India <strong>in</strong> a Warm<strong>in</strong>g Environment, Science 314,1442-1445.Guhathakurta P (2007) Highest recorded po<strong>in</strong>t ra<strong>in</strong>fall over India, Weather, December 2007,62, 12.Guhathakurta P, Rajeevan M (2008) Trends <strong>in</strong> ra<strong>in</strong>fall pattern over India, Int. J. of Climatol,28: 1453–1469.Hirsch RM, Slack JR, Smith RA (1982) Techniques of Trend Analysis for Monthly WaterQuality Data, Water Resources Research, 18, 107-121.Hosk<strong>in</strong>g J R M, Wallis J R <strong>and</strong> Wood E F (1985) Estimation of the generalized <strong>extreme</strong> valuedistribution by the method of probability weighted moments; Technometrics, 27 251–261.IPCC (2007), Fourth Assessment Report (AR4) of the United Nations Intergovernmental Panelon Climate Change.Jenk<strong>in</strong>son A F (1955) The frequency distribution of the annual maxima (or m<strong>in</strong>ima) values ofmeteorological elements; Quarterly Journal of the Royal Meteorological Society 81158–171.9
Kendall MG (1975) Rank Correlation Measures, Charles Griff<strong>in</strong>, London.Lettenmaier DP, Wood EF, Wallis JR (1994) Hydro-climatological trends <strong>in</strong> the cont<strong>in</strong>entalUnited States, 1948-88, J. Climate, 7, 586–607.Mann HB (1945), Nonparametric Tests aga<strong>in</strong>st Trend, Econometrica 13, 245-259.Rajeevan, M., Bhate J. <strong>and</strong> Jaswal, A.K.(2008) Analysis of variability <strong>and</strong> trends of <strong>extreme</strong>ra<strong>in</strong>fall <strong>events</strong> over India us<strong>in</strong>g 104 years of gridded daily ra<strong>in</strong>fall data, GeophysicalResearch Letters, 2008, Vol.35, L18707, doi 10.1029/2008GL035143.Rakhecha, PR,. Pisharoty PR (1996) Heavy ra<strong>in</strong>fall dur<strong>in</strong>g monsoon season: Po<strong>in</strong>t <strong>and</strong> spatialdistribution. Current Science, 71, 177-186.Rakhecha PR, Soman MK (1994) Trends <strong>in</strong> the annual <strong>extreme</strong> ra<strong>in</strong>fall <strong>events</strong> of 1 to 3 daysduration over India, Theoretical <strong>and</strong> Applied Climatology, 48, 4.Sen Roy S, Ball<strong>in</strong>g RC (2004) Trends <strong>in</strong> <strong>extreme</strong> daily precipitation <strong>in</strong>dices <strong>in</strong> India, Int. J.Climatol. 24: 457–466.Stephenson DB, Rupa Kumar K, Doblas-Reyes FJ, Royer JF, Chauv<strong>in</strong> F, Pezzulli S (1999)Extreme Daily Ra<strong>in</strong>fall Events <strong>and</strong> their Impact on Ensemble Forecasts of the IndianMonsoon, Monthly Weather Rev., 127, 1954-1966.10
Table 1. Occurrences of 90 cm or more ra<strong>in</strong>fall <strong>in</strong> one day <strong>in</strong> IndiaSN Station State 1-day ra<strong>in</strong>fall <strong>in</strong> Date of occurrencecm1 Cherrapunji Meghalaya 156.3 16-Jun-1995Obsy2 Am<strong>in</strong>i Divi Lakshadeep 116.8 6-May-20043 Cherrapunji Meghalaya 103.6 14-Jun-18764 Ambarnath Maharashtra 101.0 27-Jul-20055 Cherrapunji Meghalaya 99.8 12-Jul-19106 Mausynram Meghalaya 99.0 10-Jul-19527 Dharampur Gujarat 98.7 2-Jul-19418 Cherrapunji Meghalaya 98.5 13-Sep-19749 Mawsynram Meghalaya 98.0 4-Aug-198210 Tamenlong Manipur 98.0 10-Aug-197011 Cherrapunji Meghalaya 97.4 5-Jun-195612 Mawsynram Meghalaya 94.5 7-Jun-196613 Mumbai Maharashtra 94.4 27-Jul-200514 Tamenlong Manipur 94.0 28-Jul-197015 Cherrapunji Meghalaya 93.0 15-Jun-199516 Guna Madhya Pradesh 92.8 23-Aug-198217 Cherrapunji Meghalaya 92.5 27-Jun-193418 Cherrapunji Meghalaya 90.7 25-Jun-197011
Fig. 1a. Location of 2599 ra<strong>in</strong>gauge stations over India12
Fig. 1 b. Geographical location of India’s 36 meteorological sub-divisionsFig. 2. Annual frequency of normal ra<strong>in</strong>y days13
Fig. 3. Stations with significant <strong>in</strong>creas<strong>in</strong>g/decreas<strong>in</strong>g trend <strong>in</strong> frequency of ra<strong>in</strong> day at(a) 95% significant level <strong>and</strong> (b) 99% significant levelus<strong>in</strong>g Mann-Kendall non parametric trend test .14
Fig. 4. Stations with significant <strong>in</strong>creas<strong>in</strong>g/decreas<strong>in</strong>g trend <strong>in</strong> frequency of ra<strong>in</strong>y day at(a) 95% significant level <strong>and</strong> (b) 99% significant levelus<strong>in</strong>g Mann-Kendall non parametric trend test .15
Fig. 5 Stations with significant <strong>in</strong>creas<strong>in</strong>g/decreas<strong>in</strong>g trend <strong>in</strong> frequency of heavy ra<strong>in</strong>fallday at (a) 95% significant level <strong>and</strong> (b) 99% significant level us<strong>in</strong>g Mann-Kendall nonparametric trend test .16
abRa<strong>in</strong> DaysRa<strong>in</strong>y DayscHeavy Ra<strong>in</strong> DaysFig. 6. Increase/decrease <strong>in</strong> frequency of (a) Ra<strong>in</strong> Days (b) Ra<strong>in</strong>y Days<strong>and</strong> Heavy Ra<strong>in</strong>fall Days <strong>in</strong> 100 yearsFig. 7. Highest One-day Extreme Ra<strong>in</strong>fall <strong>in</strong> India17
Fig. 8. Stations with significant <strong>in</strong>creas<strong>in</strong>g/decreas<strong>in</strong>g trend <strong>in</strong> one-day <strong>extreme</strong> ra<strong>in</strong>fall at(a) 95% significant level <strong>and</strong> (b) 99% significant level us<strong>in</strong>gMann-Kendall non parametric trend test .18
Fig. 9. Increase/decrease <strong>in</strong> one day <strong>extreme</strong> ra<strong>in</strong>fall (cm) <strong>in</strong> 100 yearsFig. 10. Extreme values for 25 years return period19
1951-60 1961-701971-80 1981-901991-2000Fig. 11. Decadal variability of <strong>extreme</strong> values (cm) for 25 years return period20
3530251951-601961-701971-801981-901991-2000% FREQUENCY201510507.0 - 10.0 10.0 - 15.0 15.0-20.0 20.0 - 25.0 25.0 - 30.0 >30.0RANGE OF RETURN (EXTREME) VALUES IN CMFig. 12. Percentage frequencies of <strong>extreme</strong> values (cm) for 25 years return period <strong>in</strong>different range for each of the decade.21
N C C RESEARCH REPORTS1) New statistical models for long range forecast<strong>in</strong>g of southwest monsoon ra<strong>in</strong>fall overIndia, M. Rajeevan, D. S. Pai <strong>and</strong> Anil Kumar Rohilla, September 2005.2) Trends <strong>in</strong> the ra<strong>in</strong>fall pattern over India, P. Guhathakurta <strong>and</strong> M. Rajeevan, May 2006.3) Trends <strong>in</strong> Precipitation Extremes over India, U. R. Joshi <strong>and</strong> M. Rajeevan, October2006.4) On El N<strong>in</strong>o-Indian Monsoon Predictive Relationships, M. Rajeevan <strong>and</strong> D. S.Pai, November 2006.5) An Analysis of the Operational Long Range Forecasts of 2007 Southwest MonsoonRa<strong>in</strong>fall, R.C. Bhatia, M. Rajeevan, D.S. Pai, December 2007.6) Active <strong>and</strong> Break Spells of the Indian Summer Monsoon, M. Rajeevan, SulochanaGadgil <strong>and</strong> Jyoti Bhate, March 2008.7) Indian Summer Monsoon Onset: Variability <strong>and</strong> Prediction, D.S.Pai <strong>and</strong> M.Rajeevan, October 2007.8) Development of a High Resolution Daily Gridded Temperature Data Set (1969-2005) for the Indian Region, A K Srivastava, M Rajeevan <strong>and</strong> S R Kshirsagar,June 2008.9) A High Resolution Daily Gridded Ra<strong>in</strong>fall Data Set (1971-2005) for MesoscaleMeteorological Studies, M. Rajeevan <strong>and</strong> Jyoti Bhate, August 2008.10) Impact of MJO on the Intraseasonal Variation of Summer Monsoon Ra<strong>in</strong>fall overIndia, D. S. Pai, Jyoti Bhate, O. P. Sreejith <strong>and</strong> H.R. Hatwar, April 2009.11) Development of a high resolution daily gridded pressure data set (1969-2007) for theIndian region, A. K. Srivastava, S. R. Kshirsagar <strong>and</strong> H. R. Hatwar, April 2009.12) Mapp<strong>in</strong>g of Drought Areas over India, P.G. Gore, Thakur Prasad <strong>and</strong> H.R.Hatwar, January 2010.13) District-wise Drought Climatology Of The Southwest Monsoon Season over IndiaBased on St<strong>and</strong>ardized Precipitation Index (SPI), D. S. Pai, Latha Sridhar, PulakGuhathakurta <strong>and</strong> H. R. Hatwar.22