Changes in extreme rainfall events and flood risk in ... - (IMD), Pune
Changes in extreme rainfall events and flood risk in ... - (IMD), Pune
Changes in extreme rainfall events and flood risk in ... - (IMD), Pune

Create successful ePaper yourself
Turn your PDF publications into a flip-book with our unique Google optimized e-Paper software.
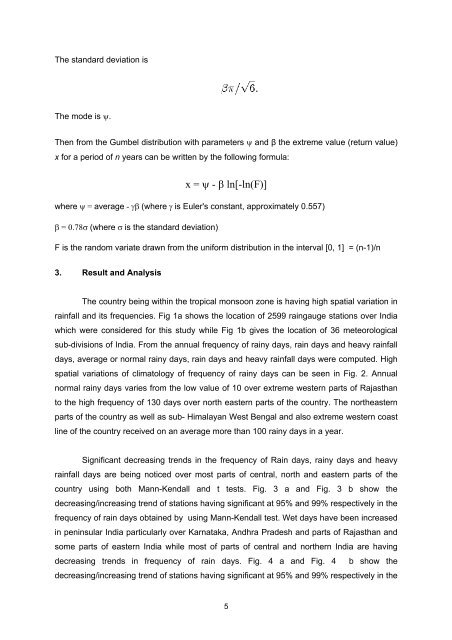
The st<strong>and</strong>ard deviation isThe mode is ψ.Then from the Gumbel distribution with parameters ψ <strong>and</strong> β the <strong>extreme</strong> value (return value)x for a period of n years can be written by the follow<strong>in</strong>g formula:x = ψ - β ln[-ln(F)]where ψ = average - γβ (where γ is Euler's constant, approximately 0.557)β = 0.78σ (where σ is the st<strong>and</strong>ard deviation)F is the r<strong>and</strong>om variate drawn from the uniform distribution <strong>in</strong> the <strong>in</strong>terval [0, 1] = (n-1)/n3. Result <strong>and</strong> AnalysisThe country be<strong>in</strong>g with<strong>in</strong> the tropical monsoon zone is hav<strong>in</strong>g high spatial variation <strong>in</strong>ra<strong>in</strong>fall <strong>and</strong> its frequencies. Fig 1a shows the location of 2599 ra<strong>in</strong>gauge stations over Indiawhich were considered for this study while Fig 1b gives the location of 36 meteorologicalsub-divisions of India. From the annual frequency of ra<strong>in</strong>y days, ra<strong>in</strong> days <strong>and</strong> heavy ra<strong>in</strong>falldays, average or normal ra<strong>in</strong>y days, ra<strong>in</strong> days <strong>and</strong> heavy ra<strong>in</strong>fall days were computed. Highspatial variations of climatology of frequency of ra<strong>in</strong>y days can be seen <strong>in</strong> Fig. 2. Annualnormal ra<strong>in</strong>y days varies from the low value of 10 over <strong>extreme</strong> western parts of Rajasthanto the high frequency of 130 days over north eastern parts of the country. The northeasternparts of the country as well as sub- Himalayan West Bengal <strong>and</strong> also <strong>extreme</strong> western coastl<strong>in</strong>e of the country received on an average more than 100 ra<strong>in</strong>y days <strong>in</strong> a year.Significant decreas<strong>in</strong>g trends <strong>in</strong> the frequency of Ra<strong>in</strong> days, ra<strong>in</strong>y days <strong>and</strong> heavyra<strong>in</strong>fall days are be<strong>in</strong>g noticed over most parts of central, north <strong>and</strong> eastern parts of thecountry us<strong>in</strong>g both Mann-Kendall <strong>and</strong> t tests. Fig. 3 a <strong>and</strong> Fig. 3 b show thedecreas<strong>in</strong>g/<strong>in</strong>creas<strong>in</strong>g trend of stations hav<strong>in</strong>g significant at 95% <strong>and</strong> 99% respectively <strong>in</strong> thefrequency of ra<strong>in</strong> days obta<strong>in</strong>ed by us<strong>in</strong>g Mann-Kendall test. Wet days have been <strong>in</strong>creased<strong>in</strong> pen<strong>in</strong>sular India particularly over Karnataka, Andhra Pradesh <strong>and</strong> parts of Rajasthan <strong>and</strong>some parts of eastern India while most of parts of central <strong>and</strong> northern India are hav<strong>in</strong>gdecreas<strong>in</strong>g trends <strong>in</strong> frequency of ra<strong>in</strong> days. Fig. 4 a <strong>and</strong> Fig. 4 b show thedecreas<strong>in</strong>g/<strong>in</strong>creas<strong>in</strong>g trend of stations hav<strong>in</strong>g significant at 95% <strong>and</strong> 99% respectively <strong>in</strong> the5