Changes in extreme rainfall events and flood risk in ... - (IMD), Pune
Changes in extreme rainfall events and flood risk in ... - (IMD), Pune
Changes in extreme rainfall events and flood risk in ... - (IMD), Pune

You also want an ePaper? Increase the reach of your titles
YUMPU automatically turns print PDFs into web optimized ePapers that Google loves.
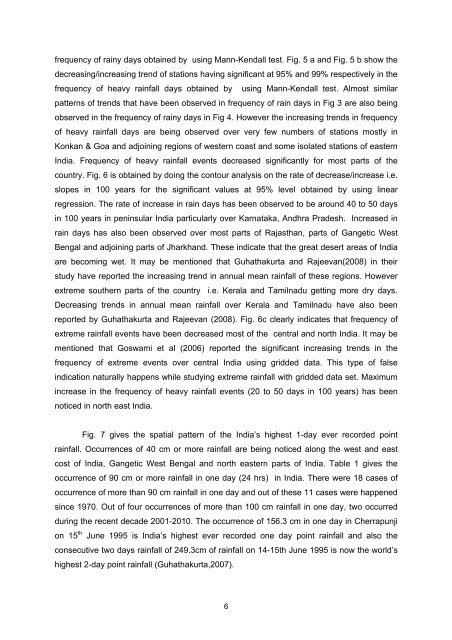
frequency of ra<strong>in</strong>y days obta<strong>in</strong>ed by us<strong>in</strong>g Mann-Kendall test. Fig. 5 a <strong>and</strong> Fig. 5 b show thedecreas<strong>in</strong>g/<strong>in</strong>creas<strong>in</strong>g trend of stations hav<strong>in</strong>g significant at 95% <strong>and</strong> 99% respectively <strong>in</strong> thefrequency of heavy ra<strong>in</strong>fall days obta<strong>in</strong>ed by us<strong>in</strong>g Mann-Kendall test. Almost similarpatterns of trends that have been observed <strong>in</strong> frequency of ra<strong>in</strong> days <strong>in</strong> Fig 3 are also be<strong>in</strong>gobserved <strong>in</strong> the frequency of ra<strong>in</strong>y days <strong>in</strong> Fig 4. However the <strong>in</strong>creas<strong>in</strong>g trends <strong>in</strong> frequencyof heavy ra<strong>in</strong>fall days are be<strong>in</strong>g observed over very few numbers of stations mostly <strong>in</strong>Konkan & Goa <strong>and</strong> adjo<strong>in</strong><strong>in</strong>g regions of western coast <strong>and</strong> some isolated stations of easternIndia. Frequency of heavy ra<strong>in</strong>fall <strong>events</strong> decreased significantly for most parts of thecountry. Fig. 6 is obta<strong>in</strong>ed by do<strong>in</strong>g the contour analysis on the rate of decrease/<strong>in</strong>crease i.e.slopes <strong>in</strong> 100 years for the significant values at 95% level obta<strong>in</strong>ed by us<strong>in</strong>g l<strong>in</strong>earregression. The rate of <strong>in</strong>crease <strong>in</strong> ra<strong>in</strong> days has been observed to be around 40 to 50 days<strong>in</strong> 100 years <strong>in</strong> pen<strong>in</strong>sular India particularly over Karnataka, Andhra Pradesh. Increased <strong>in</strong>ra<strong>in</strong> days has also been observed over most parts of Rajasthan, parts of Gangetic WestBengal <strong>and</strong> adjo<strong>in</strong><strong>in</strong>g parts of Jharkh<strong>and</strong>. These <strong>in</strong>dicate that the great desert areas of Indiaare becom<strong>in</strong>g wet. It may be mentioned that Guhathakurta <strong>and</strong> Rajeevan(2008) <strong>in</strong> theirstudy have reported the <strong>in</strong>creas<strong>in</strong>g trend <strong>in</strong> annual mean ra<strong>in</strong>fall of these regions. However<strong>extreme</strong> southern parts of the country i.e. Kerala <strong>and</strong> Tamilnadu gett<strong>in</strong>g more dry days.Decreas<strong>in</strong>g trends <strong>in</strong> annual mean ra<strong>in</strong>fall over Kerala <strong>and</strong> Tamilnadu have also beenreported by Guhathakurta <strong>and</strong> Rajeevan (2008). Fig. 6c clearly <strong>in</strong>dicates that frequency of<strong>extreme</strong> ra<strong>in</strong>fall <strong>events</strong> have been decreased most of the central <strong>and</strong> north India. It may bementioned that Goswami et al (2006) reported the significant <strong>in</strong>creas<strong>in</strong>g trends <strong>in</strong> thefrequency of <strong>extreme</strong> <strong>events</strong> over central India us<strong>in</strong>g gridded data. This type of false<strong>in</strong>dication naturally happens while study<strong>in</strong>g <strong>extreme</strong> ra<strong>in</strong>fall with gridded data set. Maximum<strong>in</strong>crease <strong>in</strong> the frequency of heavy ra<strong>in</strong>fall <strong>events</strong> (20 to 50 days <strong>in</strong> 100 years) has beennoticed <strong>in</strong> north east India.Fig. 7 gives the spatial pattern of the India’s highest 1-day ever recorded po<strong>in</strong>tra<strong>in</strong>fall. Occurrences of 40 cm or more ra<strong>in</strong>fall are be<strong>in</strong>g noticed along the west <strong>and</strong> eastcost of India, Gangetic West Bengal <strong>and</strong> north eastern parts of India. Table 1 gives theoccurrence of 90 cm or more ra<strong>in</strong>fall <strong>in</strong> one day (24 hrs) <strong>in</strong> India. There were 18 cases ofoccurrence of more than 90 cm ra<strong>in</strong>fall <strong>in</strong> one day <strong>and</strong> out of these 11 cases were happeneds<strong>in</strong>ce 1970. Out of four occurrences of more than 100 cm ra<strong>in</strong>fall <strong>in</strong> one day, two occurreddur<strong>in</strong>g the recent decade 2001-2010. The occurrence of 156.3 cm <strong>in</strong> one day <strong>in</strong> Cherrapunjion 15 th June 1995 is India’s highest ever recorded one day po<strong>in</strong>t ra<strong>in</strong>fall <strong>and</strong> also theconsecutive two days ra<strong>in</strong>fall of 249.3cm of ra<strong>in</strong>fall on 14-15th June 1995 is now the world’shighest 2-day po<strong>in</strong>t ra<strong>in</strong>fall (Guhathakurta,2007).6