Environmental Sustainable Growth - UMC
Environmental Sustainable Growth - UMC
Environmental Sustainable Growth - UMC

You also want an ePaper? Increase the reach of your titles
YUMPU automatically turns print PDFs into web optimized ePapers that Google loves.
Contents<br />
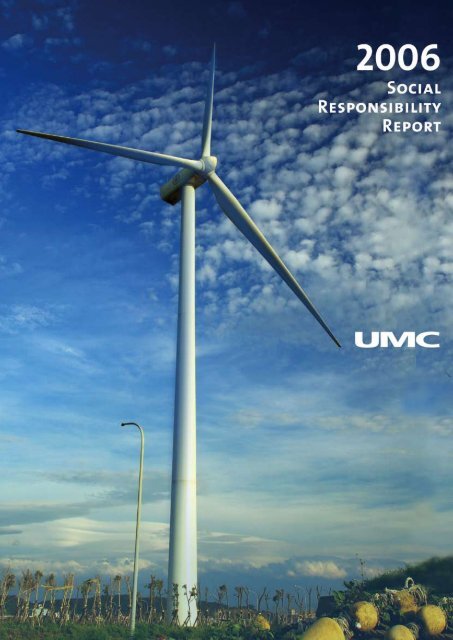
<strong>Environmental</strong> <strong>Sustainable</strong> <strong>Growth</strong><br />
Cleaner Production 16<br />
<strong>Environmental</strong> Management 24<br />
Climate Change and Global Warming 28<br />
2006 Corporate Social Responsibility Report - 15
<strong>Environmental</strong> <strong>Sustainable</strong> <strong>Growth</strong><br />
Various international protocols and regional<br />
conventions on environmental protection<br />
have been conducted over the years to<br />
seek answers for common problems that<br />
the global community has faced. To follow<br />
international trends and the demands of<br />
the industry, <strong>UMC</strong> follows all government<br />
environmental protection laws with the aim<br />
of exceeding the requirements for these<br />
laws. Related international standards<br />
on environmental protection are also<br />
considered. Furthermore, <strong>UMC</strong> expects to<br />
remain as a green enterprise by exerting<br />
greater effort into cleaner production,<br />
industrial waste reduction, pollutant<br />
prevention and risk management.<br />
Cleaner Production<br />
The definition for cleaner production is<br />
"continually adopting and integrating<br />
preventive environmental strategies in<br />
processes, products and ser vices to<br />
increase Eco-efficiency as well as to lower<br />
the impacts on human and environment."<br />
Strategies adopted for the process aspect<br />
include saving the materials and energy<br />
used, decreasing or avoiding the use of<br />
hazardous substances, and reducing the<br />
volume and the toxicity of emissions. In the<br />
product aspect, product life cycle evaluation<br />
to lower the impact on the environment is<br />
held regularly.<br />
Reuse / Recycle<br />
Pollutants<br />
Pollutant Control<br />
Pollutant Prevention<br />
Material Process<br />
Product Services<br />
Source Improvement and Process<br />
Improvement<br />
The rapid amendment and addition to<br />
government laws result in significant<br />
operation costs for every industry. <strong>UMC</strong><br />
aggressively promotes cleaner production<br />
for the purpose of sustainable operation<br />
and development. In addition to building up<br />
comprehensive databases to manage the<br />
procurement and utilization of materials,<br />
<strong>UMC</strong> also implements projects for source<br />
improvement and process improvement<br />
through ad hoc project management.<br />
Those projects are aimed at reducing<br />
materials and waste to enhance <strong>UMC</strong>’s<br />
competitiveness, including the adoption of<br />
new technologies and the improvement and<br />
optimization of processes.<br />
-Material Resources Management<br />
There are many different types of materials<br />
used in semiconductor processes; therefore<br />
<strong>UMC</strong> selectively chooses several items to<br />
continually monitor according to the result<br />
of life cycle assessment and items that are<br />
used more frequently. Among those, the<br />
usage of H 2 SO 4 , HF, H 2 O 2 , NaOH, N 2 and<br />
O 2 in the past three years are charted as<br />
below:<br />
H 2 SO 4 Usage<br />
(metric ton)<br />
6,000<br />
5,000<br />
4,000<br />
3,000<br />
2,000<br />
1,000<br />
0<br />
H 2 SO 4 Usage<br />
2004 2005 2006<br />
H 2 SO 4 Usage per Unit<br />
(kg/m 2 x100)<br />
Waste Minimization<br />
Cleaner Production Related Chart<br />
16 - 2006 Corporate Social Responsibility Report
<strong>Environmental</strong> <strong>Sustainable</strong> <strong>Growth</strong> (cont.)<br />
HF Usage<br />
(metric ton)<br />
1,000<br />
800<br />
HF Usage<br />
Accumulated Reduction Resultes for Green Production<br />
Items<br />
Fab NTD<br />
C 2 F 6 IPA HF Photoresist<br />
Fab6A 8,780,160<br />
600<br />
400<br />
200<br />
0<br />
2004 2005 2006<br />
HF Usage per Unit<br />
(kg/m 2 x100)<br />
Fab8AB 6,872,438 19,090,761<br />
Fab8C 12,554,360 20,274,436<br />
Fab8D<br />
Fab8E 54,975,513<br />
H 2 O 2 Usage<br />
(metric ton)<br />
5,000<br />
4,000<br />
3,000<br />
2,000<br />
1,000<br />
0<br />
NaOH Usage<br />
(metric ton)<br />
9,000<br />
8,000<br />
7,000<br />
6,000<br />
5,000<br />
4,000<br />
3,000<br />
2,000<br />
1,000<br />
0<br />
N 2 Usage<br />
(Nm 3 )<br />
350,000,000<br />
300,000,000<br />
150,000,000<br />
100,000,000<br />
50,000,000<br />
O 2 Usage<br />
(Nm 3 )<br />
6,000,000<br />
5,000,000<br />
4,000,000<br />
3,000,000<br />
2,000,000<br />
1,000,000<br />
0<br />
0<br />
H 2 O 2 Usage<br />
2004 2005 2006<br />
NaOH Usage<br />
2004 2005 2006<br />
N 2 Usage<br />
2004 2005 2006<br />
O 2 Usage<br />
2004 2005 2006<br />
H 2 O 2 Usage per Unit<br />
(kg/m 2 x100)<br />
HaOH Usage per Unit<br />
(kg/m 2 x100)<br />
O 2 Usage per Unit<br />
(kg/Nm 3 /m 2 x10 5 )<br />
N 2 Usage per Unit<br />
(kg/Nm 3 /m 2 x10 5 )<br />
Fab8F 1,221,340 80,617,296<br />
Fab12A 1,708,849 13,427,975<br />
Total 12,554,360 6,872,438 2,930,189 197,166,141<br />
Ratio in <strong>UMC</strong><br />
Total<br />
Decreased<br />
Amount<br />
3.41% 14.70% 6.46% 16.16%<br />
- Results of Ad Hoc Project Management<br />
In addition to building up comprehensive<br />
databases to manage the procurement<br />
and utilization of materials, <strong>UMC</strong> also<br />
implements green projects for source<br />
improvement and process improvement<br />
in each fab through ad hoc project<br />
management. <strong>UMC</strong> management’s close<br />
attention to ad hoc projects will drive<br />
employees to implement this project for<br />
the purpose of process improvement and<br />
optimization. The results for the previous<br />
year are significant- costs of materials in<br />
the year decreased by NT$ 0.2 billion.<br />
Water Conservation and Management<br />
Water reservation is not easy in Taiwan<br />
due to great fluctuations in rainfall from<br />
rainy to dry seasons. Every industry will<br />
face water shortages during extended dry<br />
weather periods. Currently Fongshan River,<br />
Toucian River and groundwater cannot<br />
provide sufficient water for the Hsinchu<br />
area, especially when water for industrial<br />
purposes accounts for a large portion of all.<br />
Since expanding the Hisnchu Science Park<br />
is a primary goal for national development,<br />
stable water supply will remain as an urgent<br />
issue for this area. The water resource<br />
deployment plan primarily relies on Lung-<br />
2006 Corporate Social Responsibility Report - 17
<strong>Environmental</strong> <strong>Sustainable</strong> <strong>Growth</strong> (cont.)<br />
en Weir, Pao-shan Reservoir and Pao-shan<br />
Second Reservoir. Lung-en Weir will be the<br />
first source, followed by the others. If the<br />
water supply is stillinsufficient, other local<br />
water resources will be redeployed such as<br />
from Yung-Ho-Shan Reservoir and other<br />
agriculture water sources.<br />
<strong>UMC</strong> does monitor the water utilization<br />
status in each fab due to occasional water<br />
shortages in Taiwan. As demand for water<br />
has risen due to fab expansion in recent<br />
years, <strong>UMC</strong> expects to lower the demand<br />
pressure for water by further expanding<br />
water recycling and reuse. This is to make<br />
the best use of limited water resources.<br />
Although water consumption in the past<br />
five years has been going up, the recycling<br />
volume and recycling rate has also been<br />
going up accordingly (Fab 12i has been<br />
included in the statistics since 2004, and<br />
50,000<br />
40,000<br />
30,000<br />
20,000<br />
10,000<br />
0<br />
100<br />
80<br />
60<br />
40<br />
20<br />
0<br />
2002 2003 2004 2005 2006<br />
Water Used<br />
Water Recycled<br />
2002 2003 2004 2005 2006<br />
Process Water Recycling Rate<br />
Total Water Recycling Rate<br />
■ Adopt CMP recycled water as cooling and<br />
cleansing water for wastewater treatment<br />
systems.<br />
■ Use ozone to disinfect within the DI<br />
s y s t e m p i p e s t o r e d u c e w a t e r<br />
consumption during flush.<br />
■ Set up the most appropriate water<br />
consumption needed in each restroom.<br />
Pollutant Emission and Control<br />
End pipe treatment has been seen as the<br />
last measure in recent years. In pollution<br />
control, <strong>UMC</strong> develops technologies to meet<br />
new laws or standards in environmental<br />
protection, while continuing to introduce<br />
highly efficient technologies and equipment<br />
for self-management by taking the overall<br />
environment into c onsideration. A ll<br />
pollution control equipment is operated<br />
and maintained by professional teams. The<br />
operation of all equipment is included in the<br />
central monitoring system and is monitored<br />
24 hour s a day to ensure emission<br />
quality. In addition, each fab will conduct<br />
examinations at wastewater and waste gas<br />
end pipes. The results in each year are in<br />
compliance with government’s standards.<br />
All examination results in 2006 are listed as<br />
below.<br />
25,000<br />
20,000<br />
15,000<br />
10,000<br />
5,000<br />
Silicon Integrated Systems Corp. has been<br />
included in the same year after the merger).<br />
-<strong>UMC</strong>'s Water Conservation Measures<br />
■ Adjust the manufacturing process recipe<br />
to lower water consumption for each<br />
piece of equipment.<br />
0<br />
2004 2005 2006 2005 2006<br />
Waste Water Discharged<br />
18 - 2006 Corporate Social Responsibility Report
<strong>Environmental</strong> <strong>Sustainable</strong> <strong>Growth</strong> (cont.)<br />
Results of Wastewater Examination at each fab in 2006<br />
Results in Q1 2006<br />
No. Items 6A 8E 8F 8S 12A Li-Hsin Fabs Administration<br />
Standard<br />
Unit<br />
Note<br />
1 pH 6.8 7.4 8.0 6.9 6.4 7.1 5~10 - -<br />
2 Water Temperature 26.6 23.9 22.3 26.0 24.6 23.1 35 ℃ -<br />
3 Suspended Solids (S.S) 2.6 124 70.0 118 183 59.0<br />
HsinChu: 300<br />
South Taiwan:<br />
250<br />
mg/L<br />
MDL=0.5mg<br />
4<br />
Biological Oxygen Demand<br />
(BOD)<br />
4.9 52.6 28.6 28.4 113 15.7<br />
HsinChu: 300<br />
Southern<br />
Taiwan: 250<br />
mg/L<br />
-<br />
5 Fluorides 7.59 4.84 6.68 0.45 4.53 7.8 15.0 mg/L MDL=0.019<br />
6<br />
Chemical Oxygen Demand<br />
(COD)<br />
86.2 90.3 41.6 40.1 207 68.8<br />
HsinChu: 500<br />
Southern<br />
Taiwan: 450<br />
mg/L<br />
MDL=2.8<br />
Results in Q2 2006<br />
No. Items 6A 8E 8F 8S<br />
Li-Hsin<br />
Fabs<br />
HSPA<br />
Standard<br />
12A<br />
STSPA<br />
Standard<br />
Unit<br />
Note<br />
1 pH 6.4 7.6 8.1 6.6 7.4 5~10 6.0 5~10 - -<br />
2 Water Temperature 26.7 27.8 24.9 25.7 24.2 35 25.0 35 ℃ -<br />
3<br />
4<br />
Suspended Solids<br />
(S.S)<br />
Biological Oxygen<br />
Demand (BOD)<br />
12.0 224 33.5 30.4 110 300 139 250 mg/L MDL=0.5mg<br />
14.2 24.1 28.3 8.6 9.8 300 22.3 250 mg/L -<br />
5 Fluorides 8.46 7.98 4.36 9.00 6.82 15.0 9.14 15.0 mg/L MDL=0.019<br />
6<br />
Chemical Oxygen<br />
Demand (COD)<br />
47.3 49.3 55.2 17.7 25.6 500 82.8 450 mg/L MDL=2.8<br />
Results in Q3 2006<br />
No. Items 6A 8E 8F 8S<br />
Li-Hsin<br />
Fabs<br />
HSPA<br />
Standard<br />
12A<br />
STSPA<br />
Standard<br />
Unit<br />
Note<br />
1 pH 7.0 7.0 6.7 7.2 7.0 5~10 6.9 5~10 - -<br />
2 Water Temperature 29.5 26.6 29.4 30.1 31.8 35 29.6 35 ℃ -<br />
3<br />
4<br />
Suspended Solids<br />
(S.S)<br />
Biological Oxygen<br />
Demand (BOD)<br />
3.2 262 49.0 27.9 144 300 203 250 mg/L MDL=0.5mg<br />
47.5 27.6 13.7 27.9 14.3 300 89.0 250 mg/L -<br />
5 Fluorides 11.1 12.8 8.75 0.37 5.08 15.0 9.15 15.0 mg/L MDL=0.019<br />
6<br />
Chemical Oxygen<br />
Demand (COD)<br />
96.6 61.1 35.5 59.1 27.6 500 174 450 mg/L MDL=2.8<br />
2006 Corporate Social Responsibility Report - 19
<strong>Environmental</strong> <strong>Sustainable</strong> <strong>Growth</strong> (cont.)<br />
Results in Q4 2006<br />
No. Items 6A 8E 8F 8S<br />
Li-Hsin<br />
Fabs<br />
HSPA<br />
Standard<br />
12A<br />
STSPA<br />
Standard<br />
Unit<br />
Note<br />
1 pH 6.1 6.7 8.2 6.4 7.8 5~10 6.6 5~10 - -<br />
2 Water Temperature 28.3 28.8 27.7 25.6 27.5 35 32.3 35 ℃ -<br />
3<br />
4<br />
Suspended Solids<br />
(S.S)<br />
Biological Oxygen<br />
Demand (BOD)<br />
9.4 158 66.0 20.0 130 300 175 250 mg/L MDL=0.5mg<br />
22.3 17.6 4.1 9.1 23.1 300 43.7 250 mg/L -<br />
5 Fluorides 5.68 5.50 4.88 0.72 8.96 15.0 3.98 15.0 mg/L MDL=0.019<br />
6<br />
Chemical Oxygen<br />
Demand (COD)<br />
68.0 68.0 11.5 26.0 76.0 500 180 450 mg/L MDL=2.8<br />
HSPA: Hsinchu Science Park Administration<br />
STSPA: Southern Taiwan Science Park Administration<br />
Examination Results of <strong>UMC</strong> Fabs' Exhaust Pipes in 2006<br />
FAB6A<br />
Pipe No.<br />
NH 3<br />
kg/hr<br />
H 2 SO 4<br />
kg/hr<br />
HCI<br />
kg/hr<br />
HF<br />
kg/hr<br />
HNO 3<br />
kg/hr<br />
H 3 PO 4<br />
kg/hr<br />
CI 2<br />
kg/hr<br />
Reduction Rate<br />
of VOCs (%)<br />
P001 2.55×10 -3 4.59×10 -4 1.49×10 -3<br />
P005 3.58×10 -3 7.51×10 -3 2.09×10 -3<br />
P008 6.33×10 -3 2.58×10 -3 1.42×10 -3 5.98×10 -4 3.73×10 -5<br />
P009 96.6<br />
P010 96.8<br />
P012 6.72×10 -5 9.81×10 -5 1.92×10 -3<br />
P014 2.23×10 -3 2.67×10 -4 1.15×10 -4 1.12×10 -4 6.52×10 -4 1.28×10 -5 2.67×10 -3<br />
FAB8A<br />
Pipe No.<br />
NH 3<br />
kg/hr<br />
H 2 SO 4<br />
kg/hr<br />
HCI<br />
kg/hr<br />
HF<br />
kg/hr<br />
HNO 3<br />
kg/hr<br />
H 3 PO 4<br />
kg/hr<br />
CI 2<br />
kg/hr<br />
Reduction Rate<br />
of VOCs (%)<br />
P003 2.7X10 -4 5.5X10 -4 4.6X10 -4 2.4X10 -4 6.0X10 -5 6.16X10 -3<br />
P005 2.6X10 -4 1.02X10 -3 1.8X10 -3 8.7X10 -4 4.0X10 -5 4.12X10 -3<br />
P007 1.2X10 -4 3.4X10 -4 3.34X10 -3 2.5X10 -3 9.0X10 -5 2.97X10 -3<br />
P010 2.56X10 -3<br />
P011 97.5<br />
P012 3.13X10 -3 1.0X10 -4 9.1X10 -4 3.1X10 -4 2.0X10 -5<br />
P201<br />
20 - 2006 Corporate Social Responsibility Report
<strong>Environmental</strong> <strong>Sustainable</strong> <strong>Growth</strong> (cont.)<br />
FAB8B<br />
Pipe No.<br />
NH 3<br />
kg/hr<br />
H 2 SO 4<br />
kg/hr<br />
HCI<br />
kg/hr<br />
HF<br />
kg/hr<br />
HNO 3<br />
kg/hr<br />
H 3 PO 4<br />
kg/hr<br />
CI 2<br />
kg/hr<br />
Reduction Rate<br />
of VOCs (%)<br />
P003 2.69X10 -3 9.2X10 -4 2.06X10 -3 6.8X10 -4 2.3X10 -4 4.76X10 -4<br />
P005 6.0X10 -5 1.4X10 -4 4.0X10 -5 1.6X10 -4 2.0X10 -5 2.31X10 -3<br />
P013 2.6X10 -3<br />
P022 98.7<br />
FAB8C<br />
Pipe No.<br />
NH 3<br />
kg/hr<br />
H 2 SO 4<br />
kg/hr<br />
HCI<br />
kg/hr<br />
HF<br />
kg/hr<br />
HNO 3<br />
kg/hr<br />
H 3 PO 4<br />
kg/hr<br />
CI 2<br />
kg/hr<br />
Reduction Rate<br />
of VOCs (%)<br />
P004 8.58×10 -4 4.69×10 -4 1.53×10 -2 5.77×10 -5 5.77×10 -5 5.53×10 -3<br />
P006 3.35×10 -3<br />
P009 94.1<br />
P010 5.29×10 -4 1.80×10 -3 3.26×10 -3 1.54×10 -3 7.12×10 -5 6.82×10 -3<br />
P302<br />
FAB8D<br />
Pipe No.<br />
NH 3<br />
kg/hr<br />
H 2 SO 4<br />
kg/hr<br />
HCI<br />
kg/hr<br />
HF<br />
kg/hr<br />
HNO 3<br />
kg/hr<br />
H 3 PO 4<br />
kg/hr<br />
CI 2<br />
kg/hr<br />
Reduction Rate<br />
of VOCs (%)<br />
P003 4.59×10 -4 4.48×10 -4 1.56×10 -3 2.40×10 -4 5.73×10 -5 5.65×10 -3<br />
P006 2.24×10 -3 5.48×10 -4 1.99×10 -3 2.20×10 -4 5.77×10 -5 5.70×10 -3<br />
P007 2.3×10 -4<br />
P009 98.5<br />
P010 9.49×10 -5 1.51×10 -4 1.15×10 -3 7.87×10 -5 3.78×10 -5 1.92×10 -3<br />
P012 1.3×10 -4<br />
2006 Corporate Social Responsibility Report - 21
<strong>Environmental</strong> <strong>Sustainable</strong> <strong>Growth</strong> (cont.)<br />
FAB8E<br />
Pipe No.<br />
NH 3<br />
kg/hr<br />
H 2 SO 4<br />
kg/hr<br />
HCI<br />
kg/hr<br />
HF<br />
kg/hr<br />
HNO 3<br />
kg/hr<br />
H 3 PO 4<br />
kg/hr<br />
CI 2<br />
kg/hr<br />
Reduction Rate<br />
of VOCs (%)<br />
P002 96.6<br />
P004 2.26×10 -3 1.33×10 -3 4.51×10 -3 1.67×10 -3 8.07×10 -5 7.77×10 -3<br />
P005 6.68×10 -3<br />
P007 9.55×10 -4 3.83×10 -4 2.76×10 -2 6.92×10 -4 3.05×10 -5 2.90×10 -3<br />
P009 2.32×10 -3<br />
P011 5.64×10 -4 2.92×10 -3 7.07×10 -2 2.32×10 -3 5.71×10 -5 5.50×10 -3<br />
P201<br />
FAB8F<br />
Pipe No.<br />
NH 3<br />
kg/hr<br />
H 2 SO 4<br />
kg/hr<br />
HCI<br />
kg/hr<br />
HF<br />
kg/hr<br />
HNO 3<br />
kg/hr<br />
H 3 PO 4<br />
kg/hr<br />
CI 2<br />
kg/hr<br />
Reduction Rate<br />
of VOCs (%)<br />
P001 5.73×10 -4 2.54×10 -3 3.38×10 -3 1.90×10 -4 6.93×10 -5 5.89×10 -3<br />
P006 1.35×10 -4 4.70×10 -4 8.26×10 -3 2.03×10 -3 1.12×10 -3 2.67×10 -3<br />
P008 3.31×10 -3<br />
P009 97.6<br />
P010 1.54×10 -4 4.27×10 -4 3.83×10 -3 3.06×10 -4 2.80×10 -5 2.82×10 -3<br />
P012 2.23×10 -3<br />
P202<br />
22 - 2006 Corporate Social Responsibility Report
<strong>Environmental</strong> <strong>Sustainable</strong> <strong>Growth</strong> (cont.)<br />
FAB8S<br />
Pipe No.<br />
NH 3<br />
kg/hr<br />
H 2 SO 4<br />
kg/hr<br />
HCI<br />
kg/hr<br />
HF<br />
kg/hr<br />
HNO 3<br />
kg/hr<br />
H 3 PO 4<br />
kg/hr<br />
CI 2<br />
kg/hr<br />
Reduction Rate<br />
of VOCs (%)<br />
P003 1.22×10 -4 6.45×10 -4 3.25×10 -3 1.39×10 -4 3.91×10 -5 3.90×10 -3<br />
P008 8.15×10 -2<br />
P009 1.25×10 -5 2.77×1054 5.24×10 -5 1.05×10 -5 2.93×10 -6 2.53×10 -4<br />
P010 93.7<br />
FAB12A<br />
Pipe No.<br />
NH 3<br />
kg/hr<br />
H 2 SO 4<br />
kg/hr<br />
HCI<br />
kg/hr<br />
HF<br />
kg/hr<br />
HNO 3<br />
kg/hr<br />
H 3 PO 4<br />
kg/hr<br />
CI 2<br />
kg/hr<br />
Reduction Rate<br />
of VOCs (%)<br />
P002 6.27×10 -4 2.08×10 -4 2.03×10 -4 1.41×10 -3 3.91×10 -5 3.97×10 -3<br />
P006 8.93×10 -5 2.48×10 -4 6.12×10 -4 1.43×10 -4 1.86×10 -5 1.88×10 -3<br />
P008 6.50×10 -3<br />
P011 1.43×10 -3<br />
P014 4.37×10 -4 9.58×10 -4 5.47×10 -4 1.16×10 -3 6.61×10 -5 6.42×10 -3<br />
P016 96.6<br />
P017 97.8<br />
P019 2.13×10 -4 4.71×10 -4 9.03×10 -5 3.00×10 -4 5.03×10 -5 4.83×10 -3<br />
P023 5.28×10 -4 1.19×10 -3 7.64×10 -4 5.28×10 -4 5.76×10 -5 5.62×10 -3<br />
P027 7.29×10 -3<br />
P029 97.5<br />
2006 Corporate Social Responsibility Report - 23
<strong>Environmental</strong> <strong>Sustainable</strong> <strong>Growth</strong> (cont.)<br />
-Waste M anagement and Resourc e<br />
Recycling<br />
<strong>UMC</strong>'s waste management is based on an<br />
economic and effective waste management<br />
system to achieve the goal of handling<br />
waste safely, hygienically, hazard-free and<br />
resourcefully. Strategies include waste<br />
reduction, resource recycling and waste<br />
treatment. <strong>UMC</strong> promotes waste and<br />
resource recycling based on the concept of<br />
green production. <strong>UMC</strong> hopes to achieve<br />
the goal of waste reduction through source<br />
management measures such as process<br />
improvement and materials reduction.<br />
Moreover, <strong>UMC</strong> aggressively promotes<br />
waste recycling and reuse to replace<br />
current end pipe treatment measures to<br />
transform garbage into useful resources.<br />
This not only lowers the resources and<br />
costs to handle the waste but also helps<br />
to ease environmental strain. Finally, <strong>UMC</strong><br />
regularly checks waste treatment vendors,<br />
strictly controls the flow of the waste and<br />
implements optimized measures to handle<br />
the waste.<br />
In 2006, <strong>UMC</strong> produced a total of 15,265<br />
metric tons of waste, in which 12,103 metric<br />
tons were recycled, resulting in a recycling<br />
rate of 79%. Most of the recycled waste are<br />
solvents, sulfuric acid and sludge. Waste<br />
produced is climbing in recent years due<br />
to volume production of Fab 12A; however<br />
waste being recycled and reuse is climbing<br />
as well.<br />
Sulfuric Acid 29%<br />
Water Recycling Ratio in 2006<br />
Other 15%<br />
Solvents 33%<br />
Sludge 23%<br />
Solvents<br />
Sludge<br />
Other<br />
Sulfuric Acid<br />
Weight (tons)<br />
20000<br />
15000<br />
10000<br />
5000<br />
0<br />
2002~2005 Waste Recycling Rate<br />
2002 2003 2004 2005 2006<br />
Waste Volume Recycling Volume Recycling Rate<br />
Ratio<br />
86%<br />
84%<br />
82%<br />
80%<br />
78%<br />
76%<br />
74%<br />
72%<br />
70%<br />
<strong>Environmental</strong> Management<br />
The rise of environmental protection<br />
awareness benefits those companies<br />
who have outstanding performance in<br />
environmental protection work while<br />
competing in the international market.<br />
Therefore, <strong>UMC</strong> has continued to put efforts<br />
in environmental protection work over<br />
the years. <strong>Environmental</strong> management<br />
tools have been introduced wthin <strong>UMC</strong>,<br />
such as environmental management<br />
system, product life cycle assessment,<br />
environmental accounting system and<br />
others. <strong>UMC</strong> expects to continually and<br />
spontaneously make improvements by<br />
adopting environmental management<br />
measures to achieve the practical goal of<br />
improving and lowering the impacts on the<br />
environment.<br />
<strong>Environmental</strong>, Safety and Health<br />
Management System<br />
As issues in environmental, safety and<br />
health become diverse and significant,<br />
GRM& ESH Division was established<br />
in 1998 to be responsible for planning<br />
the company's policy and strategies for<br />
risk management. Moreover, GRM&ESH<br />
Division introduces effective systems and<br />
provides safety and health expertise to<br />
build a safe, healthy and nature-friendly<br />
environment. An environmental safety and<br />
health management committee is formed in<br />
each fab to discuss self-managed items. In<br />
addition, a company-wide industrial safety<br />
meeting is held quarterly and attended by<br />
24 - 2006 Corporate Social Responsibility Report
<strong>Environmental</strong> <strong>Sustainable</strong> <strong>Growth</strong> (cont.)<br />
high-level executives. This quarterly meeting<br />
is held to discuss issues that include<br />
environmental safety and health operation,<br />
international environmental, safety and<br />
health trends and execution suggestions.<br />
This meeting also is held to periodically<br />
review the results and performance of<br />
the company’s environmental safety and<br />
health operations. With the participation<br />
and support of high-level executives, <strong>UMC</strong><br />
builds a top-down, communication-effective<br />
environmental, safety and health system.<br />
- Certification for ISO14001&OHSAS18001<br />
<strong>UMC</strong> is aggressively involved in the<br />
establishment and execution of safety<br />
and health management system since the<br />
establishment of international standards.<br />
F a b 8 C p r o m o t e d e n v i r o n m e n t a l<br />
management system and safety and<br />
health system at the same time and was<br />
certificated for ISO14001&OHSAS18001<br />
in 2000. In 2001, <strong>UMC</strong> led the industry in<br />
certification as the whole company received<br />
ISO14001 and OHSAS18001 certifications.<br />
to request detailed environmental impact<br />
evaluations for various products during the<br />
stages of material exploit, manufacturing,<br />
assembling, selling, utilizing and disposing,<br />
to seek ideal manufacturing methods that<br />
cause minimum impact on the environment.<br />
This is the concept of Life Cycle for product<br />
management.<br />
Life Cycle Assessment (LCA) is an essential<br />
tool for environmental management<br />
developed in 1960s. LCA refers to the<br />
process of a product from materials,<br />
manufacturing, and utilization to discard,<br />
from the cradle to the grave. According<br />
to the definition of ISO 14040, LCA is a<br />
method used to evaluate environmental<br />
factors and potential impacts of a product.<br />
Therefore, each product can use LCA<br />
as a tool for improvements in processes,<br />
activities, and the product itself while<br />
pollution occurs. This will further help<br />
decision makers take more environmental<br />
measures into their consideration.<br />
System Boundaries<br />
Product System<br />
Enter<br />
Processes<br />
Enter<br />
(Materials)<br />
Acquire<br />
.... Disposal<br />
Life Cycle<br />
Waste<br />
Life Cycle Assessment<br />
Environment (not disturbed by human factors)<br />
The Definition of Life Cycle Assessment<br />
Product Life Cycle Assessment<br />
Recycling Rate<br />
System<br />
Establishment<br />
ISO 14040<br />
Life Cycle Assessment<br />
Choice of packaging /<br />
materials<br />
Reuse / Recycle System<br />
After managing back-end pollution control<br />
for twenty years, European countries<br />
and Japan now realize that pollution<br />
resulting from product consumption will<br />
exceed pollution resulting from product<br />
manufacturing. Therefore they have begun<br />
Costs<br />
<strong>Environmental</strong> Concerns<br />
Green Marketing /<br />
Customer Requirement<br />
The Application of Life Cycle Assessment<br />
2006 Corporate Social Responsibility Report - 25
<strong>Environmental</strong> <strong>Sustainable</strong> <strong>Growth</strong> (cont.)<br />
In 20 05, <strong>UMC</strong> authorized Industrial<br />
Technology Research Institute (ITRI) to<br />
implement Life Cycle Assessment in each<br />
fab. From raw silicon to chips, investigations<br />
w e r e c o n d u c t e d t a r g e t i n g e n e r g y<br />
consumption, materials and pollutants of<br />
each product. Through the evaluation of<br />
environmental impact on the entire supply<br />
chain and manufacturing processes, the<br />
impact on the environment resulting from<br />
products is clarified and the result of<br />
evaluations is used as a reference for the<br />
environmental management system.<br />
Fab basic information check<br />
Material consumption check<br />
Water, electricity, fuel and<br />
wafer check<br />
Pollutant emission check<br />
Supplier information<br />
confirmation<br />
Information<br />
standardization<br />
Index calculation<br />
Index analysis<br />
Impact assessment<br />
Report drafting<br />
Supplier information check<br />
Life-Cycle Assessment Flow at <strong>UMC</strong><br />
Supplier information<br />
response<br />
<strong>UMC</strong> has already completed an "Eco-<br />
Profile" in all its 150mm fabs and 200mm<br />
fabs. Externally, Eco-Profile conforms to<br />
all international environmental protection<br />
regulations and can be provided to <strong>UMC</strong>'s<br />
customers as a reference for the impact on<br />
the environment in product manufacturing<br />
processes; internally, it can be used as a<br />
basic standard for further improvement.<br />
According to the evaluations, the major<br />
material used in manufacturing processes<br />
is water, followed by air, coal and crude oil.<br />
However, air is deemed as a renewable<br />
resource that cannot be depleted. Water<br />
consumption causes the most impact<br />
to the environment, followed by energy<br />
consumption and the greenhouse effect.<br />
<strong>Environmental</strong> Accounting System<br />
At present enterprises'<br />
efforts in environmental<br />
p r o t e c t i o n a d d r e s s<br />
investment in current<br />
t e c h n o l o g i e s a n d<br />
equipment, and aims<br />
to elaborate the overall<br />
functions by combining<br />
efficient environmental<br />
management tools.<br />
Among various environmental<br />
management<br />
tools, environmental<br />
a c c o u n t i n g s y s t e m<br />
provides the foundation<br />
for corporate environmental reports and<br />
plays the role as the medium for information<br />
disclosure.<br />
<strong>Environmental</strong> accounting, also known as<br />
green accounting, is a critical information<br />
tool that helps to understand the impact and<br />
influences on the environment in national<br />
economic development and corporate<br />
business operations by c alculating<br />
environmental costs. It is crucial in lowering<br />
the harm on the environment and improving<br />
environmental protection results. <strong>UMC</strong><br />
implemented its environmental accounting<br />
system and became the first high-tech<br />
corporation to use an accounting method<br />
so comprehensive. <strong>UMC</strong>’s environmental<br />
ac c ounting system is based on the<br />
classifications of Japan Ministry of the<br />
Environment. In addition to an environmental<br />
finance system, <strong>UMC</strong> established a financial<br />
information system for safety and health.<br />
The <strong>UMC</strong> environmental accounting system<br />
combines current accounting systems and<br />
uses pattern comparison and an internal<br />
coding method to calculate <strong>UMC</strong>’s invested<br />
costs and expenditures on environmental<br />
protection. This helps <strong>UMC</strong> conduct<br />
26 - 2006 Corporate Social Responsibility Report
<strong>Environmental</strong> <strong>Sustainable</strong> <strong>Growth</strong> (cont.)<br />
overall environmental benefit evaluations<br />
and conduct decision-making analyses.<br />
<strong>UMC</strong> also established an e-database<br />
for information collection, sorting out<br />
related expenditure and expenses and<br />
conducting calculations and<br />
analyses every month for<br />
management. Based on the<br />
information, management<br />
draws up cost- ef f icient<br />
environmental management<br />
measures to cover both<br />
business operations and<br />
environmental protection.<br />
- <strong>Environmental</strong> Protection<br />
Expenditure Report<br />
<strong>UMC</strong>'s determination in<br />
environmental protection<br />
can be demonstrated by<br />
its significant expenditure<br />
annually in environmental<br />
protection. In 2006, <strong>UMC</strong>'s<br />
total capital expenditure for<br />
environmental protection<br />
equipment was NT$ 743<br />
million, accounting for 0.71%<br />
of <strong>UMC</strong>’s overall capital<br />
ex p enditure. T he main<br />
portion of this expenditure,<br />
87.67%, was used for fees<br />
associated with the annual<br />
maintenance of various<br />
pollution prevention and<br />
control equipment, followed<br />
by waste treatment and<br />
resource recycling and<br />
environmental protection<br />
related management and<br />
activities costs. NT$1.43<br />
million was used for global environmental<br />
protection issues.<br />
Estimated expenditures in 2007 include:<br />
1. Modernization and upgrade of current<br />
pollution control facilities, 2. Operational<br />
fees of NT$ 28 million per month for<br />
pollution control facilities, 3. Handling fees<br />
related to waste treatment of NT$ 4.2 million<br />
per month and 4. <strong>Environmental</strong> monitoring<br />
<strong>Environmental</strong> Protection Expenditure Report in 2006<br />
Classifications in<br />
<strong>Environmental</strong> Costs<br />
1.Direct costs to lower<br />
loads on the environment<br />
2.Indirect costs to lower<br />
loads on the environment<br />
3. Other costs in<br />
environmental protection<br />
(1)<br />
4. Other costs in<br />
environmental protection<br />
(2)<br />
Illustration<br />
In thousands NTD<br />
Capital<br />
Expenditure<br />
Expenses<br />
1-1 Pollution control costs, including:<br />
a. Air pollution control<br />
b. Water pollution control<br />
c. Other pollution control<br />
d. Above expenses include environmental<br />
personnel expenses 317,475 326,724<br />
1-2 Drainage utilization fees 0 34,416<br />
1-3 Handling fees for waste treatment 0 49,287<br />
2-1 <strong>Environmental</strong> monitoring fees 0 3,194<br />
2-2 R&D fees in environmental protection 0 1,428<br />
3-1 <strong>Environmental</strong> training fees<br />
3-2 Management systems implementation<br />
fees and verification fees<br />
3-3 Derivative fees from waste reduction<br />
and recycling<br />
3-4 Derivative fees for improving water<br />
resource's efficiency<br />
3-5 Expenses in global environmental<br />
protection<br />
4-1 Soil rebuild and environment<br />
renovation fees<br />
4-2 <strong>Environmental</strong> pollution insurance fees<br />
4-3 Government taxes for environmental<br />
protection<br />
4-4 Penalties and lawsuit fees for<br />
environmental problems<br />
0 10,764<br />
0 0<br />
amount 317,475 425,813<br />
Waste Treatment<br />
Fees 6.63%<br />
NT$ 49.29 million<br />
Management and<br />
Activities costs 6.70%<br />
NT$ 49.80 million<br />
Pollution<br />
Prevention<br />
Fees 86.67%<br />
NT$ 644.20 million<br />
<strong>Environmental</strong> Protection Expenditure Ratio in 2006<br />
2006 Corporate Social Responsibility Report - 27
<strong>Environmental</strong> <strong>Sustainable</strong> <strong>Growth</strong> (cont.)<br />
Climate Change and Global<br />
Warming<br />
Global climate change results from<br />
accumulated occurrences over thousands<br />
of years. Human activities significantly<br />
influence the earth's climate; greenhouse<br />
gases are rapidly discharged into the air,<br />
which results in the enhancement of the<br />
greenhouse effect and the increase of the<br />
average temperature. Regional climate<br />
change not only changes the forests, the<br />
agriculture harvests and water supply<br />
but also poses threats tohumans and<br />
endangers birds, fishes and other ecological<br />
systems. The deserts expand to plains and<br />
many unique landscapes in national parks<br />
of each country will eventually disappear.<br />
Human's influence on the environment<br />
affects the surface of the earth as well as<br />
the air. Finally, the influence will expand to<br />
cover the globe as the air circulates.<br />
Greenhouse Gas Reduction and<br />
Management<br />
As global warming effects worsen, <strong>UMC</strong><br />
hopes to fulfill its responsibility as a<br />
corporate citizen by helping to reduce the<br />
increasing emissions of global greenhouse<br />
gases. With a vision of sustained growth<br />
and operation, <strong>UMC</strong>'s countermeasures are<br />
already in place.<br />
-Current Status of Greenhouse Gas<br />
Emissions<br />
<strong>UMC</strong> has established greenhouse gas<br />
emission inventory following the requirement<br />
of ISO 14064-1 and Greenhouse Gas<br />
Protocol. According to the data in 2005<br />
and 2006, the major sources of <strong>UMC</strong>'s<br />
greenhouse gas emissions are CO 2 from<br />
power generating process and PFCs from<br />
semiconductor manufacturing processes<br />
such as CF 4 ,C 4 F 6 ,SF 6 ,NF 3 ,CHF 3 ,C 3 F 8 and<br />
C 4 F 8 . These two resources account for 94%<br />
of <strong>UMC</strong>'s overall emission of greenhouse<br />
gases.<br />
<strong>UMC</strong>'s Overall Emission of Greenhouse Gases<br />
Volume<br />
(tonnes CO2e)<br />
2,000<br />
1,800<br />
1,600<br />
1,400<br />
1,200<br />
1,000<br />
800<br />
600<br />
400<br />
200<br />
0<br />
Current Status of <strong>UMC</strong>'s Greenhouse<br />
Gas Emissions (Note: Numbers in Taiwan<br />
in 2005 were confirmed by a third party<br />
verifier)<br />
Green House Gases<br />
from Power<br />
Generating<br />
Source of <strong>UMC</strong>'s Greenhouse Gases<br />
-Reduction Plan<br />
2005 2006<br />
Others<br />
PFCs from Manufacturing Processes<br />
Green House Gases from Power Generating<br />
Other Source (N 2 O, Natural Gas, Diesel Oil...)<br />
PFCs from Manufacturing<br />
Processes<br />
Singapone<br />
Taiwan (R.O.C.)<br />
<strong>UMC</strong> established its "PFCs Emission<br />
Reduction Team" in 1999 to implement<br />
the reduction plan. Currently, <strong>UMC</strong> has<br />
targeted PFC emission reduction by "10%<br />
in 2010 compared to 1998 (the emission<br />
of 1998 is the MMTCE average of 1997<br />
and 1999) levels". PFCs are Perfluorinated<br />
Compounds that are used in semiconductor<br />
processes. Major elements of the PFC<br />
emission reduction plan include:<br />
1. U s e C 3 F 8 t o r e p l a c e C 2 F 6 i n<br />
semiconductor thin film process to lower the<br />
emission volume of greenhouse gases.<br />
2. Measure the utilization rate of machines<br />
that use PFCs and the reduction rate of<br />
the treatment equipment to master the<br />
efficiency of machines and hence conduct<br />
improvement measures toward inefficient<br />
machines.<br />
28 - 2006 Corporate Social Responsibility Report
<strong>Environmental</strong> <strong>Sustainable</strong> <strong>Growth</strong> (cont.)<br />
3. Conduct individual usage evaluation for<br />
each machine that uses PFCs to better<br />
understand greenhouse gas emissions for<br />
each machine.<br />
4. Continue researching and testing<br />
substitute gases, and lowering the use of<br />
gases with a high potential of contributing<br />
to the greenhouse effect by reducing the<br />
source emission.<br />
5. Meanwhile, in order to lower the PFC<br />
emissions year by year, <strong>UMC</strong> plans to install<br />
high efficiency PFC abatement systems<br />
after fully evaluating all new models.<br />
-Results<br />
<strong>UMC</strong> led the industry in replacing the high<br />
GWP (Global Warming Potential) gas C2F6<br />
with low GWP gas C3F8 in CVD chamber<br />
cleaning. In 2004, <strong>UMC</strong>’s Fab 8AB was the<br />
first foundry fab to complete gas substitution.<br />
Other fabs also completed gas substitution<br />
afterwards. <strong>UMC</strong> has outstanding results in<br />
PFCs reduction, estimated 548,649 tons of<br />
CO2e were replaced in 2006.<br />
For machines and equipment that measure<br />
Result of Replacing C 2 F 6 with C 3 F 8 in 2006<br />
Emission Volume ( tonnes CO 2 e/year )<br />
900<br />
800<br />
700<br />
600<br />
500<br />
400<br />
300<br />
200<br />
100<br />
0<br />
Before (C 2 F 6 ) After (C 3 F 8 )<br />
Gases<br />
and control PFC gases , in addition to<br />
continually evaluating and adopting new<br />
equipment, <strong>UMC</strong> also measures the<br />
utilization rate of machines that use PFCs<br />
and the reduction rate of the treatment<br />
equipment to master the efficiency of<br />
machines and hence conduct improvement<br />
measures or optimization toward inefficient<br />
machines. Estimated results in 2006 were<br />
551,115 tons of CO2e.<br />
-Inventory and Verification<br />
U M C c o m p l eted t h e i nve ntor y a n d<br />
verification in greenhouse gas emissions<br />
with TSIA (Taiwan Semiconductor Industrial<br />
Association). The greenhouse gas emission<br />
inventory system has been established<br />
and qualified by a third party, and <strong>UMC</strong><br />
has passed PFC emission requirements<br />
for all its Taiwan fabs. <strong>UMC</strong> will continue<br />
to require annual third party greenhouse<br />
gas emission inventory to ensure that <strong>UMC</strong><br />
completely adheres to the current status of<br />
greenhouse gas usage.<br />
C e r t i f i c a t e f o r P a s s i n g G H G E V<br />
(Greenhouse Gas Emissions Verification)<br />
for All <strong>UMC</strong> Taiwan Fabs in 2005<br />
Energy Saving and Management<br />
Taiwan's power structure mainly relies on<br />
thermal power by burning petrochemistry<br />
fuel, which accounts for 76.3% of total<br />
power. <strong>UMC</strong>’s energy consumption mainly<br />
relies on electricity, followed by natural<br />
gas. <strong>UMC</strong>’s energy consumption status<br />
is charted below, though Fab 12i is not<br />
included since the calculating unit is<br />
different (LPG instead of NG is used in Fan<br />
12i). Silicon Integrated Systems Corp. was<br />
merged into <strong>UMC</strong> in 2004, and Fab 8S has<br />
been included since April 2004.<br />
2006 Corporate Social Responsibility Report - 29
<strong>Environmental</strong> <strong>Sustainable</strong> <strong>Growth</strong> (cont.)<br />
1,600<br />
1,400<br />
1,200<br />
800<br />
600<br />
400<br />
200<br />
0<br />
1,8000<br />
1,6000<br />
1,4000<br />
1,2000<br />
10,000<br />
8,000<br />
6,000<br />
2,000<br />
0<br />
Power Consumption (MWH)<br />
2002 2003 2004 2005 2006<br />
Gas Consumption (NM 3 )<br />
2003 2004 2005 2006<br />
Power Consumption per Unit (MWH/m 2 )<br />
20<br />
15<br />
10<br />
5<br />
Energy utilization consumes the earth's<br />
resources and results in the greenhouse<br />
effect. According to the data provided by<br />
Bureau of Energy, Ministry of Economic<br />
Affairs, each kilowatt-hour will result in 0.62<br />
kilogram of CO 2 . As a global citizen, <strong>UMC</strong><br />
has no hesitation in acting against global<br />
climate change. To lower the impact of the<br />
greenhouse effect on the environment,<br />
<strong>UMC</strong> sets annual goals and plans to lower<br />
the emissions of greenhouse gases. In<br />
addition to continual assessment and<br />
introduction of various energy saving<br />
technologies, <strong>UMC</strong> also implements energy<br />
saving plans to directly slow the company's<br />
energy consumption. Furthermore, <strong>UMC</strong><br />
promotes energy saving programs in the<br />
office and public areas accompanied with<br />
promotion activities and training to enhance<br />
employees' ideas and habits in energy<br />
saving and greenhouse gas reduction.<br />
0<br />
2003 2004 2005 2006<br />
-<strong>UMC</strong>'s Energy Saving Measures<br />
Energy Saving Measures<br />
Improvement on the main engine by adopting recycled hot<br />
water for cooling system and 37º PUMP operation<br />
Set converters at the air conditioning system outside the<br />
cleanrooms<br />
Adopt “Ball Room + SMIF” system design for cleanrooms<br />
Set converters at process exhaust systems<br />
Lower the air conditioning outside cleanrooms<br />
Add inverters at process cooling systems<br />
Improve gas consumption efficiency in VOC system<br />
Improve cold water and hot water systems<br />
Improvements on the cooling water discharging system to the<br />
air processing mechanism to reduce air loss<br />
Add COP System conversion control at cooling systems<br />
Add external heating dryers<br />
Clean the coolers in air compressors Atlas AP-12<br />
Energy saving measures for office air conditioning system and<br />
car park exhaust system<br />
Fab lighting system improvement<br />
Energy Saving Measures<br />
Adjust FFU speed at cleanrooms<br />
Lower the machines’ output power while idling<br />
Adjust to high vacuum operation mode<br />
Adjust to CDA operation mode CDA<br />
Add converters to cooling system HW PUMP<br />
Lower MAU temperature<br />
Adjustment on hot water operation mode<br />
Add heat exchanger in PCW System<br />
Reduce Truss lighting<br />
Energy saving engineering on air conditioning system<br />
Amendment on 2B3T HEX pipes to lower gas consumption at<br />
boilers<br />
Reduce gas emission from manufacturing processes<br />
Decrease CDA pressure<br />
Reduce air loss at air compressor CDA/HCDA<br />
30 - 2006 Corporate Social Responsibility Report