View/Open - TWAS & OWSD Thesis Repository Home
View/Open - TWAS & OWSD Thesis Repository Home
View/Open - TWAS & OWSD Thesis Repository Home

Create successful ePaper yourself
Turn your PDF publications into a flip-book with our unique Google optimized e-Paper software.
fruits per entry per replication were measured by digital Vernier Calliper and fruit<br />
shape index was calculated as an average of the ratio (P/E) of five fruits per entry<br />
per replication.<br />
2.7 Statistical analysis<br />
2.7.1 Analysis of variance<br />
Randomized block design experiment was analyzed by standard analyses of<br />
variance and tests of significance at P< 0.05 for each trait.<br />
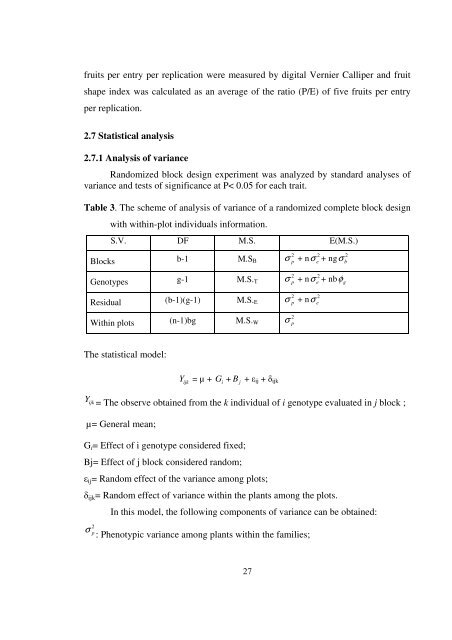
Table 3. The scheme of analysis of variance of a randomized complete block design<br />
with within-plot individuals information.<br />
S.V. DF M.S. E(M.S.)<br />
Blocks b-1 M.S B<br />
Genotypes g-1 M.S. T<br />
Residual (b-1)(g-1) M.S. E<br />
Within plots (n-1)bg M.S. W<br />
σ + nσ + ngσ<br />
2<br />
p<br />
2<br />
σ<br />
p<br />
+ nσ 2 e<br />
+ nbφ<br />
g<br />
σ + nσ<br />
2<br />
p<br />
2<br />
σ<br />
p<br />
2 e<br />
2 e<br />
2 b<br />
The statistical model:<br />
Y<br />
ijk = The observe obtained from the k individual of i genotype evaluated in j block ;<br />
µ= General mean;<br />
Y<br />
ijk<br />
= µ +<br />
G i = Effect of i genotype considered fixed;<br />
Bj= Effect of j block considered random;<br />
G + B + ε ij + δ ijk<br />
ε ij = Random effect of the variance among plots;<br />
δ ijk = Random effect of variance within the plants among the plots.<br />
In this model, the following components of variance can be obtained:<br />
2<br />
σ<br />
p : Phenotypic variance among plants within the families;<br />
i<br />
j<br />
27


![SYNTHESIS AND ANTI-HIV ACTIVITY OF [d4U]-SPACER-[HI-236 ...](https://img.yumpu.com/30883288/1/190x245/synthesis-and-anti-hiv-activity-of-d4u-spacer-hi-236-.jpg?quality=85)