Cancer Program Annual Report - Eisenhower Medical Center
Cancer Program Annual Report - Eisenhower Medical Center
Cancer Program Annual Report - Eisenhower Medical Center

Create successful ePaper yourself
Turn your PDF publications into a flip-book with our unique Google optimized e-Paper software.
E I S E N H O W E R M E D I C A L C E N T E R<br />
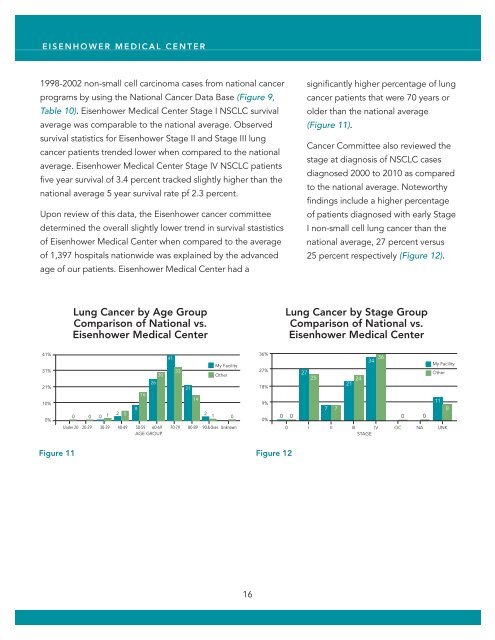
1998-2002 non-small cell carcinoma cases from national cancer<br />
programs by using the National <strong>Cancer</strong> Data Base (Figure 9,<br />
Table 10). <strong>Eisenhower</strong> <strong>Medical</strong> <strong>Center</strong> Stage I NSCLC survival<br />
average was comparable to the national average. Observed<br />
survival statistics for <strong>Eisenhower</strong> Stage II and Stage III lung<br />
cancer patients trended lower when compared to the national<br />
average. <strong>Eisenhower</strong> <strong>Medical</strong> <strong>Center</strong> Stage IV NSCLC patients<br />
five year survival of 3.4 percent tracked slightly higher than the<br />
national average 5 year survival rate pf 2.3 percent.<br />
Upon review of this data, the <strong>Eisenhower</strong> cancer committee<br />
determined the overall slightly lower trend in survival stastistics<br />
of <strong>Eisenhower</strong> <strong>Medical</strong> <strong>Center</strong> when compared to the average<br />
of 1,397 hospitals nationwide was explained by the advanced<br />
age of our patients. <strong>Eisenhower</strong> <strong>Medical</strong> <strong>Center</strong> had a<br />
significantly higher percentage of lung<br />
cancer patients that were 70 years or<br />
older than the national average<br />
(Figure 11).<br />
<strong>Cancer</strong> Committee also reviewed the<br />
stage at diagnosis of NSCLC cases<br />
diagnosed 2000 to 2010 as compared<br />
to the national average. Noteworthy<br />
findings include a higher percentage<br />
of patients diagnosed with early Stage<br />
I non-small cell lung cancer than the<br />
national average, 27 percent versus<br />
25 percent respectively (Figure 12).<br />
Lung <strong>Cancer</strong> by Age Group<br />
Comparison of National vs.<br />
<strong>Eisenhower</strong> <strong>Medical</strong> <strong>Center</strong><br />
Lung <strong>Cancer</strong> by Stage Group<br />
Comparison of National vs.<br />
<strong>Eisenhower</strong> <strong>Medical</strong> <strong>Center</strong><br />
41%<br />
31%<br />
21%<br />
10%<br />
0%<br />
16<br />
30<br />
26<br />
8<br />
1 2 5<br />
2<br />
0 0 0<br />
1 0<br />
Under 20 20-29 30-39 40-49 50-59 60-69 70-79 80-89 90 & Over Unknown<br />
AGE GROUP<br />
41<br />
33<br />
21<br />
14<br />
My Facility<br />
Other<br />
36%<br />
27%<br />
18%<br />
9%<br />
0%<br />
34 36<br />
27<br />
25 24<br />
21<br />
7 7<br />
0 0 0<br />
0 I II III IV OC NA UNK<br />
STAGE<br />
0<br />
My Facility<br />
Other<br />
11<br />
8<br />
Figure 11<br />
Figure 12<br />
16