12.540 Homework #1 Solution: March 8, 2006 Question 1: (a ... - MIT
12.540 Homework #1 Solution: March 8, 2006 Question 1: (a ... - MIT
12.540 Homework #1 Solution: March 8, 2006 Question 1: (a ... - MIT

You also want an ePaper? Increase the reach of your titles
YUMPU automatically turns print PDFs into web optimized ePapers that Google loves.
<strong>12.540</strong> <strong>Homework</strong> <strong>#1</strong> <strong>Solution</strong>: <strong>March</strong> 8, <strong>2006</strong><br />
<strong>Question</strong> 1: (a) Convert geodetic position 290 deg Long 42 deg latitude<br />
ellipsoidal height 0 m into Cartesian and geocentric coordinates.<br />
(b) How far apart on the surface of the Earth (approximate radius 6371km) would be<br />
locations that have geocentric latitude 42 deg and geodetic latitude 42 deg. Give<br />
answer in km.<br />
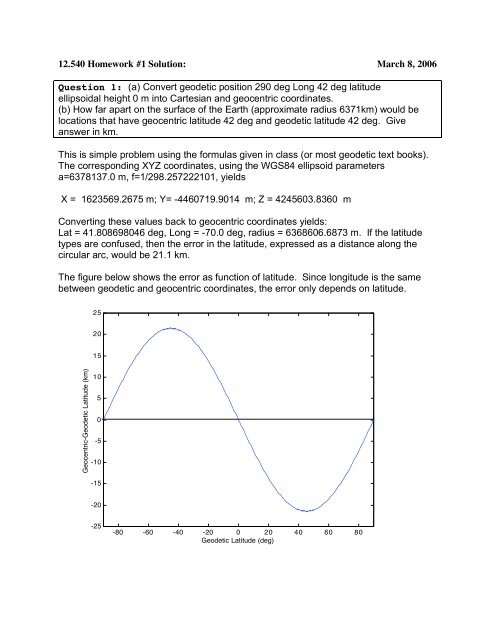
This is simple problem using the formulas given in class (or most geodetic text books).<br />
The corresponding XYZ coordinates, using the WGS84 ellipsoid parameters<br />
a=6378137.0 m, f=1/298.257222101, yields<br />
X = 1623569.2675 m; Y= -4460719.9014 m; Z = 4245603.8360 m<br />
Converting these values back to geocentric coordinates yields:<br />
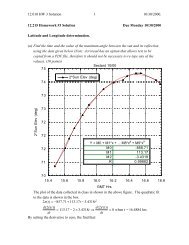
Lat = 41.808698046 deg, Long = -70.0 deg, radius = 6368606.6873 m. If the latitude<br />
types are confused, then the error in the latitude, expressed as a distance along the<br />
circular arc, would be 21.1 km.<br />
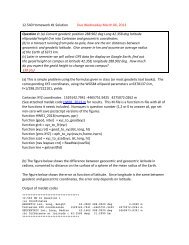
The figure below shows the error as function of latitude. Since longitude is the same<br />
between geodetic and geocentric coordinates, the error only depends on latitude.<br />
25<br />
20<br />
15<br />
Geocentric-Geodetic Latitude (km)<br />
10<br />
5<br />
0<br />
-5<br />
-10<br />
-15<br />
TextEnd<br />
-20<br />
-25<br />
-80 -60 -40 -20 0 20 40 60 80<br />
Geodetic Latitude (deg)
<strong>Question</strong> 2: A broadcast ephemeris file for <strong>March</strong> 10, 2005 is given below. All of the<br />
GPS satellites are given. For at least the set of PRN’s 2, 4, 5, 6, 10, 13, 29, 30 compute<br />
(1) A 3-D plot of the trajectories of the motions of the satellites in<br />
(a) Inertial space. Produce plots for 2 orbits of the satellites. Comment on the how<br />
closely the satellite tracks overlap.<br />
(b) Earth fixed frame. Plots for 2 orbits of the satellites.<br />
(2) A ground track plot (i.e., the track of the satellite position radially projected to the<br />
surface of the sphere). OPTIONAL: show projection onto an ellipsoid (Projection of<br />
ground normal to the satellite).<br />
(3) A sky map for geocentric location 288.9 deg Long, 42.35 deg latitude. A sky map<br />
shows azimuth and zenith distance (90-elevation angle) as a radial plot with zenith<br />
distance scaled to a convenient distance unit.<br />
(1.a) The broadcast ephemeris formulas can be used except that in computing the<br />
corrected longitude of the ascending node (page 100 of ICD200C), the value for the<br />
rotation rate of the Earth (" ˙ e ) is set to zero (thus removing the rotation of the Earth).<br />
Figure 1 shows one view of the inertial orbits. (Note: the Earth is shown only for scale.<br />
It will be rotating in this figure. However, the direction toward Greenwich on the figure<br />
does show the direction of the inertial X-axis). The dots are shown in the orbit every 5<br />
minutes. The positions ! of each satellite are shown at 18:00 GPST on <strong>March</strong> 10, 2005.<br />
Only the six satellites listed above are shown in the Figure. Note: Although PRN 02 and<br />
PRN 04 appear to be in similar orbit planes, they are quite separated from each other.<br />
PRN 13 and 29 are also in the same planes.
Figure 1: Inertial view of orbits. Viewed from declination 20 degs and Right Ascension -<br />
70 degs. During GPS week 1313, the satellites were in the following planes: Plane 00<br />
01, 13, 14, 23, 26, 29; Plane 01 08, 09, 25, 27; Plane 02 05,16,28, 30; Plane 03 03, 06,<br />
07, 19, 31; Plane 04 02, 04, 11, 15, 21, 24; Plane 05 10,18, 20, 22. Notice that PRN 13<br />
and 29 are in the same plane.
(1.b) Earth fixed orbits. These are generated using the formulas for the broadcast<br />
ephemeris. The results are shown in Figure 2. In this case, the formulas in the<br />
ICD200C document are used exactly as they appear. The positions are marked at<br />
18:00 GPST. This time is same as the times on broadcast ephemeris messages (i.e.,<br />
the t used in calculating the orbital positions is 0 seconds). Getting the time correct will<br />
be important for the next homework exercise where the satellite positions will be used to<br />
compute theoretical range data to be compared to measured pseudo ranges.<br />
The table below shows the positions of the satellites at 66.66 ms before 2005 03 10 19<br />
10 55.0 (the time of the first pseudo-range measurement in the rinex data file to be<br />
processed in the next homework).<br />
+ Earth fixed coordinates of satellites at 2005 03 10 19 10 55.0<br />
+ Satellite Position at t-66.66 us<br />
+PRN Xe (m) Ye (m) Ze (m) SV Clock (m)<br />
+ 2 9765466.34 -13599456.20 20292695.85 -8407.86<br />
+ 4 22480614.98 -6774560.72 12728477.54 104895.42<br />
+ 10 1799111.47 -21270012.64 15542080.62 18014.65<br />
+ 13 13788437.92 5599780.49 21934165.00 -2791.42<br />
+ 30 -17399601.08 -17000822.65 10546267.67 15558.06<br />
+ 29 8202491.09 -23370201.59 -9099890.97 27106.11<br />
+ 6 -14281982.60 -7080164.07 21442134.84 52417.51
Figure2: Earth fixed coordinates of satellites from broadcast ephemeris.
(2) Ground track: This is simply a matter of converting the XYZ Earth-fixed coordinates<br />
of the satellite to latitude (either geodetic or geocentric was OK) and longitude and<br />
plotting the results. The results are shown in Figure 3 with the stars showing the<br />
location on Jan 16, 2002 at 20:00 hrs GPS-time.
(3) Sky plots of tracks of satellites for latitude 42.35 deg, longitude 288.90 deg. The<br />
basic method for solving this problem is take the ground-station to satellite unit-vector<br />
which is known in global XYZ coordinates and rotating it into a local North, West, Up<br />
frame. In this frame, the azimuth and elevation can be compute using the same<br />
formulae used compute latitude and longitude. Below I give Fortran code fragments<br />
that be used for the calculation.<br />
Rotation matrix from XYZ to NEU (In the definition below the E is the East coordinate<br />
and the local system is left-handed.<br />
c lat_i is the latitude (rads in Fortran), long is longitude. rot_mat is<br />
c matrix that rotates from XYZ to NEU.<br />
c.... latitude -- north component<br />
rot_mat(1,1) = -sin(lat_i)*cos(long)<br />
rot_mat(1,2) = -sin(lat_i)*sin(long)<br />
rot_mat(1,3) = -cos(lat_i)<br />
c<br />
c.... longitude -- east component<br />
rot_mat(2,1) = -sin(long)<br />
rot_mat(2,2) = cos(long)<br />
rot_mat(2,3) = 0.d0<br />
c<br />
c.... radius -- up component<br />
rot_mat(3,1) = cos(lat_i) * cos(long)<br />
rot_mat(3,2) = cos(lat_i) * sin(long)<br />
rot_mat(3,3) = sin(lat_i)<br />
The satellite-ground station vector, converted to unit vector is multiplied by rot_mat to<br />
get local topocentric coordinates. These are converted to azimuth and elevation angle<br />
using:<br />
* Compute the horizontal length of the unit vector. unit_loc is the<br />
* station to satellite unit vector rotated into the local frame, hlen is<br />
* horizontal component the vector. Zen_dist is the angle from zenith to<br />
* satellite (rads), and azimuth is the azimuth from North (rad).<br />
hlen = sqrt(unit_loc(1)**2+unit_loc(2)**2)<br />
zen_dist = atan2(hlen, unit_loc(3))<br />
azimith = atan2(unit_loc(2),unit_loc(1))<br />
Applying the above algorithm generates the sky plot shown below.<br />
Note: North points to the right in this plot, and azimuth runs counter-clockwise (opposite<br />
of the normal method). These are "features" of the plotting package used.<br />
Note: The plot has been generated for 1-solar day (that is the normal day). The<br />
satellites do not quite get back to their point because the orbital period of GPS is one<br />
sidereal day. It takes an extra 4 minutes to get back to where the satellite started.
Figure 3a: Shows the sky-tracks for the first 7-satellites. Positions are marked at 18:00<br />
GPST on Jan 16, 2002.
Figure 3b: Sky plots for all of the 28 satellites in the broadcast ephemeris file. (The<br />
satellite labels appearing off the plot are for those satellites below the horizon at the<br />
initial time).