Jiri Masek, Milan Kroulik, Zdenek Kviz, Vaclav Prosek Czech ...
Jiri Masek, Milan Kroulik, Zdenek Kviz, Vaclav Prosek Czech ...
Jiri Masek, Milan Kroulik, Zdenek Kviz, Vaclav Prosek Czech ...

You also want an ePaper? Increase the reach of your titles
YUMPU automatically turns print PDFs into web optimized ePapers that Google loves.
ENGINEERING FOR RURAL DEVELOPMENT Jelgava, 26.-27.05.2011.<br />
By monitoring these parameters the yield maps can be created. Spatially-related data of<br />
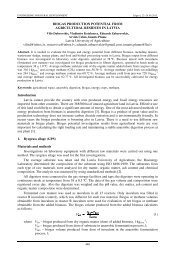
throughput of the material were recorded in the data logger. Pulses of a potentiometer and machine<br />
position from DGPS receiver were at the same time recording to the data logger, too. The recording<br />
interval was set to 2 s.<br />
1<br />
2<br />
3<br />
Fig. 1. Location potentiometer on the belt tensioning mechanism: 1 – belt tension roller<br />
mechanism; 2 – connecting rod; 3 – potentiometer<br />
Results and discussion<br />
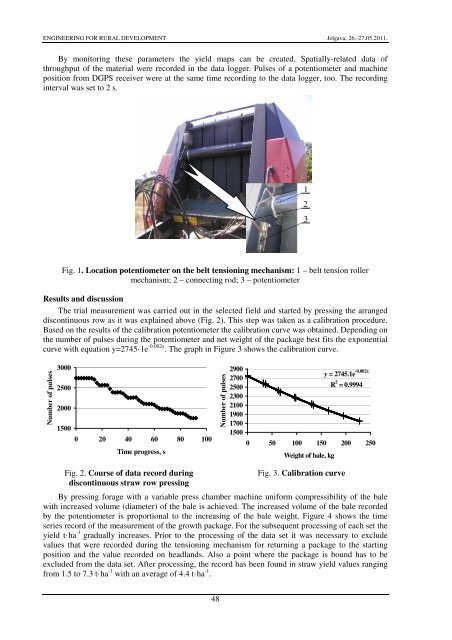
The trial measurement was carried out in the selected field and started by pressing the arranged<br />
discontinuous row as it was explained above (Fig. 2). This step was taken as a calibration procedure.<br />
Based on the results of the calibration potentiometer the calibration curve was obtained. Depending on<br />
the number of pulses during the potentiometer and net weight of the package best fits the exponential<br />
curve with equation y=2745·1e -0.002x . The graph in Figure 3 shows the calibration curve.<br />
Number of pulses<br />
3000<br />
2500<br />
2000<br />
1500<br />
0 20 40 60 80 100<br />
Time progress, s<br />
Number of pulses<br />
2900<br />
2700<br />
2500<br />
2300<br />
2100<br />
1900<br />
1700<br />
1500<br />
y = 2745.1e -0.002x<br />
R 2 = 0.9994<br />
0 50 100 150 200 250<br />
Weight of bale, kg<br />
Fig. 2. Course of data record during<br />
discontinuous straw row pressing<br />
Fig. 3. Calibration curve<br />
By pressing forage with a variable press chamber machine uniform compressibility of the bale<br />
with increased volume (diameter) of the bale is achieved. The increased volume of the bale recorded<br />
by the potentiometer is proportional to the increasing of the bale weight. Figure 4 shows the time<br />
series record of the measurement of the growth package. For the subsequent processing of each set the<br />
yield t·ha -1 gradually increases. Prior to the processing of the data set it was necessary to exclude<br />
values that were recorded during the tensioning mechanism for returning a package to the starting<br />
position and the value recorded on headlands. Also a point where the package is bound has to be<br />
excluded from the data set. After processing, the record has been found in straw yield values ranging<br />
from 1.5 to 7.3 t·ha -1 with an average of 4.4 t·ha -1 .<br />
48