Jiri Masek, Milan Kroulik, Zdenek Kviz, Vaclav Prosek Czech ...
Jiri Masek, Milan Kroulik, Zdenek Kviz, Vaclav Prosek Czech ...
Jiri Masek, Milan Kroulik, Zdenek Kviz, Vaclav Prosek Czech ...

You also want an ePaper? Increase the reach of your titles
YUMPU automatically turns print PDFs into web optimized ePapers that Google loves.
ENGINEERING FOR RURAL DEVELOPMENT Jelgava, 26.-27.05.2011.<br />
Pulses<br />
2900<br />
2700<br />
2500<br />
2300<br />
2100<br />
1900<br />
1700<br />
1500<br />
0 50 100 150 200 250 300 350 400 450 500<br />
Time progress, s<br />
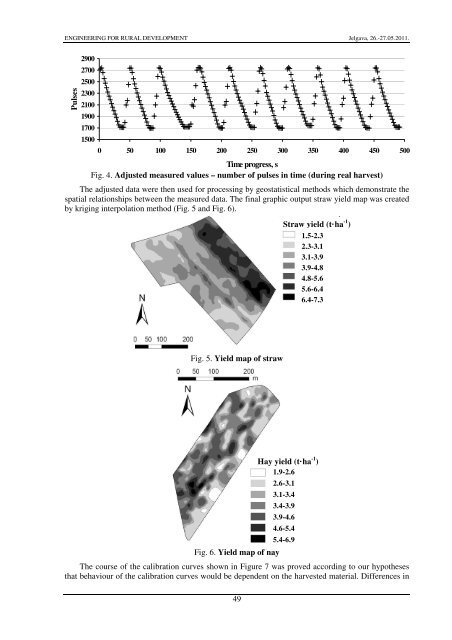
Fig. 4. Adjusted measured values – number of pulses in time (during real harvest)<br />
The adjusted data were then used for processing by geostatistical methods which demonstrate the<br />
spatial relationships between the measured data. The final graphic output straw yield map was created<br />
by kriging interpolation method (Fig. 5 and Fig. 6).<br />
Straw yield (t·ha -1 )<br />
1.5-2.3<br />
2.3-3.1<br />
3.1-3.9<br />
3.9-4.8<br />
4.8-5.6<br />
5.6-6.4<br />
6.4-7.3<br />
Fig. 5. Yield map of straw<br />
Fig. 6. Yield map of hay<br />
The course of the calibration curves shown in Figure 7 was proved according to our hypotheses<br />
that behaviour of the calibration curves would be dependent on the harvested material. Differences in<br />
49<br />
Hay yield (t·ha -1 )<br />
1.9-2.6<br />
2.6-3.1<br />
3.1-3.4<br />
3.4-3.9<br />
3.9-4.6<br />
4.6-5.4<br />
5.4-6.9