experimental investigation in acceleration of vehicles
experimental investigation in acceleration of vehicles
experimental investigation in acceleration of vehicles

Create successful ePaper yourself
Turn your PDF publications into a flip-book with our unique Google optimized e-Paper software.
ENGINEERING FOR RURAL DEVELOPMENT Jelgava, 27.-28.05.2010.EXPERIMENTAL INVESTIGATION IN ACCELERATION OF VEHICLESAndris L<strong>in</strong><strong>in</strong>s, Da<strong>in</strong>is BerjozaLatvia University <strong>of</strong> Agriculture, Faculty <strong>of</strong> Eng<strong>in</strong>eer<strong>in</strong>g, Motor Vehicle Istituteda<strong>in</strong>is.berjoza@llu.lvAbstract. Today, there is a variety <strong>of</strong> automotive constructions with different suspension designs that affect thecharacter <strong>of</strong> runn<strong>in</strong>g. Specific suspension may be more or less suitable for road and traffic conditions. Vehiclespeed variations and <strong>acceleration</strong> can significantly affect cargo ma<strong>in</strong>ta<strong>in</strong><strong>in</strong>g and passenger comfort, so theseparameters were chosen for the object <strong>of</strong> the study. A method for record<strong>in</strong>g and analyz<strong>in</strong>g vehicle <strong>acceleration</strong>was developed and approbated. Vehicle suspension systems may be suitable for different motion modes and theroad conditions and <strong>in</strong>fluences <strong>of</strong> the smoothness <strong>of</strong> runn<strong>in</strong>g, handl<strong>in</strong>g and <strong>acceleration</strong> <strong>in</strong> the transversedirection. The ma<strong>in</strong> automotive s<strong>of</strong>tness <strong>in</strong>dicators are technical frequency and angular frequency.Characteristics <strong>of</strong> runn<strong>in</strong>g s<strong>of</strong>tness depends on the road surface and driv<strong>in</strong>g.Keywords: <strong>acceleration</strong>, direction <strong>of</strong> <strong>acceleration</strong>, driv<strong>in</strong>g comfort, measurement methods, device.IntroductionVehicles <strong>of</strong> different age and technical condition are be<strong>in</strong>g exploited on roads with variouscondition levels <strong>in</strong> Latvia. Some <strong>vehicles</strong> are operated <strong>of</strong>f-road. Acceleration <strong>in</strong> different directionsseriously affects the cargo compartment and the passengers.The study aims to f<strong>in</strong>d out what forces are act<strong>in</strong>g on the <strong>vehicles</strong>, if to drive at different speedmodes along different routes and cover corners. The <strong><strong>in</strong>vestigation</strong>al item is a vehicle, <strong>acceleration</strong>values and directions. The vehicle, the nature <strong>of</strong> the motion set at different driv<strong>in</strong>g modes, and bottomcoverage <strong>of</strong> asphalt roads, as well as the <strong>acceleration</strong> changes <strong>in</strong> the law - <strong>in</strong> the city and beyond. S<strong>of</strong>ar, no approbated methodology for evaluat<strong>in</strong>g <strong>acceleration</strong> <strong>of</strong> the automotive operat<strong>in</strong>g conditions hasbeen developed <strong>in</strong> Latvia. A simple method was developed dur<strong>in</strong>g trials for accurate determ<strong>in</strong>ation <strong>of</strong>the vehicle <strong>acceleration</strong> <strong>of</strong> an accelerometer EK3LV02DL. The method approbated tests <strong>of</strong> the carRENAULT TRAFFIC.Materials and methodsRide comfort. In general, passenger ride comfort boundaries are difficult to determ<strong>in</strong>e because <strong>of</strong>the variations <strong>in</strong> <strong>in</strong>dividual sensitivity to vibration and <strong>of</strong> a lack <strong>of</strong> a generally accepted method <strong>of</strong>approach to the assessment <strong>of</strong> human response to vibration. Considerable research has been conductedby a number <strong>of</strong> <strong>in</strong>vestigators <strong>in</strong> an attempt to def<strong>in</strong>e the ride comfort limits. A variety <strong>of</strong> methods forassess<strong>in</strong>g human tolerance to vibration have been developed over the years. They <strong>in</strong>clude thefollow<strong>in</strong>g.1. Subjective Ride Measurements. The traditional technique for compar<strong>in</strong>g the vehicle ride quality<strong>in</strong> the automotive <strong>in</strong>dustry <strong>in</strong> the past was to use a tra<strong>in</strong>ed jury to rate the ride comfort, on a relativebasis, <strong>of</strong> different <strong>vehicles</strong> driven over a range <strong>of</strong> road surfaces. With a large enough jury and a welldesignedevaluation scheme, this method could provide a mean<strong>in</strong>gful comparison <strong>of</strong> the ride quality <strong>of</strong>different <strong>vehicles</strong>. The degree <strong>of</strong> difference <strong>in</strong> the ride quality cannot be quantitatively determ<strong>in</strong>ed bythis type <strong>of</strong> subjective evaluation.2. Shake Table Tests. In an attempt to quantitatively study human response to vibration, a largenumber <strong>of</strong> shake table experiments have been performed. Most <strong>of</strong> this research perta<strong>in</strong>s to humanresponse to s<strong>in</strong>usoidal excitation. It is <strong>in</strong>tended to identify the zones <strong>of</strong> comfort or discomfort forhumans <strong>in</strong> terms <strong>of</strong> vibration amplitude, velocity, or <strong>acceleration</strong> <strong>in</strong> a given direction such as foot-tohead,side-to-side, or back-to-chest, over a specific frequency range.3. Ride Simulator Test. In these tests, ride simulators are used to replicate the vibration <strong>of</strong> thevehicle travell<strong>in</strong>g over different road surfaces, <strong>in</strong> some facilities an actual vehicle body is mounted onhydraulic actuators, witch reproduce vehicle motions <strong>in</strong> pitch, roll, and bounce or heave. Road <strong>in</strong>putsare fed <strong>in</strong>to the actuators. Us<strong>in</strong>g the simulator, it is possible to establish the human tolerance limits <strong>in</strong>terms <strong>of</strong> vibration parameters.4. Ride Measurements <strong>in</strong> Vehicle. The shake table tests and ride simulator tests described aboveare conduced under laboratory conditions. They do not necessarily provide the same vibration149
ENGINEERING FOR RURAL DEVELOPMENT Jelgava, 27.-28.05.2010.environments to which the passenger is subject while driv<strong>in</strong>g on the road. Therefore, on-the-road ridemeasurements, particularly for passenger cars, have been performed. This test method attempts tocorrelate the response <strong>of</strong> test subjects <strong>in</strong> qualitative terms, such as “unpleasant” or “<strong>in</strong>tolerable,” withvibration parameters measured at the location where the test subject is situated under actual driv<strong>in</strong>gconditions [1].Any variation <strong>in</strong> the body can be described us<strong>in</strong>g the follow<strong>in</strong>g parameters: oscillation period T,amplitude z, angular frequency ω sv and technical frequency n sv , speed <strong>of</strong> v sv , fluctuations <strong>in</strong> the rate <strong>of</strong>change <strong>of</strong> speed or <strong>acceleration</strong> j sv , fluctuations <strong>in</strong> the mean square <strong>acceleration</strong> δ sv , the rate <strong>of</strong> change<strong>of</strong> <strong>acceleration</strong> j sv . It is <strong>of</strong>ten used to describe fluctuations <strong>in</strong> the technical frequency n sv ,oscillation/m<strong>in</strong>, which is characterized by fluctuations <strong>in</strong> the number per m<strong>in</strong>ute:where T – oscillation period, s.1n sv= [Hz], (1)TMotor fluctuation effects on the human organism depend on the oscillation frequency, amplitude,fluctuations <strong>in</strong> <strong>in</strong>tensity, direction and duration <strong>of</strong> exposure, so this effect on the human organism isvery impressive. The human body has best suited-oscillation parameters that are specific to the humanbody movements. Depend<strong>in</strong>g on the speed <strong>of</strong> walk<strong>in</strong>g oscillation frequency changes <strong>in</strong> the humanbody, and people are best adapted to fluctuations <strong>in</strong> the frequency <strong>of</strong> the n sv = 65-110, and they causethe least fatigue. If the oscillation frequency is less than 60 fluctuations·m<strong>in</strong> -1 , people feel thesw<strong>in</strong>g<strong>in</strong>g, especially if there are large-amplitude fluctuations. Conversely, if the oscillation frequencyexceeds 150 oscillations·m<strong>in</strong> -1 , the fluctuations are unpleasant, harmful and cause fatigue. From theseobservations also it is desirable that the vertical oscillation amplitude does not exceed 35-40 mm. Ithas been <strong>experimental</strong>ly shown that the human body is most sensitive to vertical movements, feels thefluctuations <strong>in</strong> the longitud<strong>in</strong>al direction and is very sensitive to fluctuations <strong>in</strong> the transversedirection. If the fluctuation rate is up to 0.035 m·s -1 , they are felt, if the speed is 0.1-0.2 m·s -1 , they arefelt, and if the speed is above 0.3 m·s -1 , the fluctuations are uncomfortable. With <strong>in</strong>creas<strong>in</strong>g oscillationfrequency, even small fluctuations <strong>in</strong> the <strong>acceleration</strong> <strong>in</strong> humans can cause discomfort (Table 1).Table 1Fluctuation <strong>of</strong> <strong>acceleration</strong> effects on human bodyOscillation frequency, n sv,oscillations·m<strong>in</strong> -1 Human sense that depends on oscillation<strong>acceleration</strong>, m·s -2unpleasant pa<strong>in</strong>ful60 2.3 2.790 2.1 2.5120 1.9 2.3180 1.7 2.0Fluctuations <strong>in</strong> the car after their exposure to the human body can be divided <strong>in</strong>to two groups:high-frequency fluctuations with what ma<strong>in</strong>ly the car wheels vary (1080-90 000 fluctuations·m<strong>in</strong> -1 )and low-frequency fluctuations (up to 1080 fluctuations·m<strong>in</strong> -1 ), with what essentially the car bodyvaries. When exposed to the frequencies <strong>of</strong> the car body fluctuations, the speed <strong>of</strong> <strong>acceleration</strong>changes has a great importance. If the fluctuation rate <strong>of</strong> the change <strong>of</strong> <strong>acceleration</strong> exceeds 25, m·s -3 ,it causes discomfort for humans, but reach<strong>in</strong>g 40 m·s -3 – they are very poorly tolerated [3].Over the years, numerous ride comfort criteria have been proposed. One <strong>of</strong> such criteria forvertical vibration is described <strong>in</strong> the Ride and Vibrations Data Manual J6a <strong>of</strong> the Society <strong>of</strong>automotive Eng<strong>in</strong>eers. The recommended limits shown <strong>in</strong> the figure are also referred to as Janeway’scomfort criterion. It def<strong>in</strong>es the acceptable amplitude <strong>of</strong> vibration as a function <strong>of</strong> frequency. It can beseen that as the frequency <strong>in</strong>creases, the allowable amplitude decreases considerably. The Janewaycomfort criterion consists <strong>of</strong> three simple relationships, each <strong>of</strong> which covers a specific frequencyrange. In the frequency range 1-6 Hz, the peak value <strong>of</strong> jerk, which is the product <strong>of</strong> the amplitude andthe cube <strong>of</strong> circular frequency, should not exceed 12.6 m·s -3 . For <strong>in</strong>stance, at 1 Hz (2π rad·s -1 ), therecommended limit for amplitude is 12.6 m·s -3 (2π ·s -1 ) -3 = 0.0508 m. In the frequency range 6-20 Hz,150
ENGINEERING FOR RURAL DEVELOPMENT Jelgava, 27.-28.05.2010.the peak value <strong>of</strong> <strong>acceleration</strong>, which is the product <strong>of</strong> the amplitude and square <strong>of</strong> the circularfrequency, should be less than 0.33 m·s -2 , whereas <strong>in</strong> the range 20-30 Hz, the peak value <strong>of</strong> velocity,which is the product <strong>of</strong> the amplitude and circular frequency, should not exceed 2.7 mm s -1 . It shouldbe noted, that Janeway’s comfort criterion is based on the data for vertical s<strong>in</strong>usoidal vibration <strong>of</strong> as<strong>in</strong>gle frequency [1].Experimental studies <strong>of</strong> <strong>acceleration</strong>. The <strong><strong>in</strong>vestigation</strong>al object is a car produced <strong>in</strong> 2007Renault Traffic (gross weight <strong>of</strong> 2835 kg, 1957 kg unloaded weight, tires 195/65R16C RoadstoneEURO-WIN 650, the tread depth <strong>of</strong> 8 mm, tire pressure 3.4 bar front axle, rear axle 3.7 bar, thechassis type front axle <strong>in</strong>dependent McPherson-type suspension, dependent rear suspension systemwith a monolithic bridge beams and leaf spr<strong>in</strong>gs, 1995 cm 3 diesel eng<strong>in</strong>e with 66 kW power).The studies were conducted <strong>in</strong> 2009, on the 15 th and 22 nd <strong>of</strong> April <strong>in</strong> Jelgava, Jelgava region,Dobele and the region. The weather conditions were good, the w<strong>in</strong>d speed was 2-3 m·s -1 , the airpressure 770 mm·hg -1 , no precipitation was. The bottom roads were <strong>in</strong> good condition, recently gradedwithout pits.In total <strong>in</strong> the experiments 99 426 measurements were obta<strong>in</strong>ed, <strong>of</strong> which the selection forcharacterization <strong>of</strong> specific motion regimes was done. Only the data, obta<strong>in</strong>ed perform<strong>in</strong>g the tasks <strong>in</strong>the planned regimes – different driv<strong>in</strong>g modes along the bottom road out <strong>of</strong> town, were used andprocessed.In the experiments two devices were used:• ELM SCAN 5 USB which transforms the eng<strong>in</strong>e speed and speed signals sent from the car <strong>in</strong>a format that may be perceived to be used by a computer program.• EK3LV02DL 3 sharp outgo<strong>in</strong>g low-voltage l<strong>in</strong>ear accelerometer or g sensor.The AUTO PROCESS MONITOR can write data from the two facilities. First, calibrat<strong>in</strong>gaccelerometer for changes to program sett<strong>in</strong>gs. Calibration sett<strong>in</strong>gs for each channel w<strong>in</strong>dow <strong>in</strong>stalled<strong>in</strong> the appropriate parameters.Technology research program.1. Vehicles placed <strong>in</strong> a flat position. Turn on the ignition, the added diagnostic nest ELM SCAN5USB converter.2. Plug the computer power unit SBS adopter Car Notebook PC A090 cable car 12 V socket.Measur<strong>in</strong>g equipment connected to the signal wire to the computer.3. Place the tripod <strong>in</strong> the car accelerometer steel plate and secure to an accelerometer attachedEK3LV02DL (Figure 2a).4. Turn on the accelerometer program. Indicate a connection port and press the button "connect" theaccelerometer illum<strong>in</strong>ates the green diode. Then press the "start" button and "dir detect" – mov<strong>in</strong>gthe accelerometer <strong>in</strong> the set operational direction. Once all parameters are entered, anaccelerometer is attached to the stand <strong>in</strong> the car stand and levered.5. The AUTO PROCESS MONITORS program is opened. The monitor<strong>in</strong>g mode, data are shown <strong>in</strong>the graph <strong>in</strong> real time. Each channel corresponds to one specified colour l<strong>in</strong>e. The channels are <strong>in</strong>the follow<strong>in</strong>g order: revolutions per m<strong>in</strong>ute (rpm), speed, air flow (MAP), 3 axis <strong>of</strong> accelerometer(Figure 1).6. Dur<strong>in</strong>g the pilot runs the value <strong>of</strong> different driv<strong>in</strong>g modes was fixed <strong>in</strong> the computer. Depend<strong>in</strong>gon the time axis data the driv<strong>in</strong>g regime is recorded <strong>in</strong> the experiment notes. They are used foridentification <strong>of</strong> the correspond<strong>in</strong>g motion regime, through data process<strong>in</strong>g after the experiment.Results and discussionVertical <strong>acceleration</strong> Z studies have been conducted on ground travel, with 8-speed modes from20 to 90 km·h -1 <strong>in</strong> <strong>in</strong>crements <strong>of</strong> 10 km·h -1 . The experiments were made on a highway to Dobele,Jelgava, Līvbērze.151
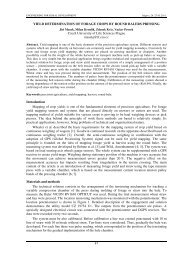
ENGINEERING FOR RURAL DEVELOPMENT Jelgava, 27.-28.05.2010.rpmj zj xvj yFig. 1. APM curve while driv<strong>in</strong>g at a speed <strong>of</strong> 60 km·h -1Figure 1 shows the monitor w<strong>in</strong>dow dur<strong>in</strong>g the experiment on gravel road at speed v = 60 km·h -1 .From the <strong>acceleration</strong> curves <strong>of</strong> the data selection, the curves are designed <strong>in</strong> Figure 2. A separate<strong>in</strong>creased vertical <strong>acceleration</strong> curve can be seen on Figure 3.1412Acceleration m•s -2108642X axleY axleZ axle0-20 10 20 30 40 50 60 70 80 90 100MeasurmentFig. 2. Value <strong>of</strong> <strong>acceleration</strong> driven at a speed <strong>of</strong> 60 km·h -1The car body frequency at 60 km·h -1 on the bottom <strong>of</strong> travel:1 1n sv 60= = = 1.05 [Hz] (2)T 0.95The average vertical <strong>acceleration</strong> <strong>in</strong> this mode was 0.82 m·s -2 , the maximum vertical <strong>acceleration</strong>at 2.57 m·s -2 ; as Table 1 shows this treatment results <strong>in</strong> human motion discomfort. The oscillationperiod T was calculated between the major peaks <strong>in</strong> the measurement range. Each subsequentmeasurement is recorded on each <strong>of</strong> 0.05 s. In-between the 1 st and 2 nd highest peak there were 19measurements.To analyse the mutual <strong>acceleration</strong> values demonstratively <strong>in</strong> different driv<strong>in</strong>g regimes Figure 4was developed where the average <strong>acceleration</strong> values <strong>in</strong> the researched motion regimes aresummarized. With <strong>in</strong>creas<strong>in</strong>g <strong>of</strong> the motion speed on gravel roads the vertical <strong>acceleration</strong> has atendency to decrease at 70-80 km·h -1 , that could be related to co<strong>in</strong>cidence <strong>of</strong> the body oscillationfrequency with the suspension oscillation frequency or resonance.152
ENGINEERING FOR RURAL DEVELOPMENT Jelgava, 27.-28.05.2010.13Acceleration, m·s -212111098Z axle70 10 20 30 40 50 60 70 80 90 100Measurement1.20Fig. 3. Vertical <strong>acceleration</strong> values-2Acceleration, m·s1.000.800.600.400.670.41 0.420.680.820.480.490.970.200.0020 30 40 50 60 70 80 90-1Speed, km·hFig. 4. Vertical <strong>acceleration</strong> changes <strong>in</strong> various driv<strong>in</strong>g modesConclusions1. Automotive suspension systems may be suitable for different motion modes, and the roadconditions and <strong>in</strong>fluences, ma<strong>in</strong>ly the car runn<strong>in</strong>g smooth, handl<strong>in</strong>g and <strong>acceleration</strong> <strong>in</strong> thetransverse direction.2. The developed <strong>experimental</strong> methodology was approved and recommended for use <strong>in</strong> furtherresearch. In the next stages <strong>of</strong> the research the operation journal is to be replaced by synchronizedweb-cameras.3. Increas<strong>in</strong>g the movement velocity on the bottom <strong>of</strong> the road surface, the vertical <strong>acceleration</strong> hasa tendency to decl<strong>in</strong>e at 70 to 80 60 km·h -1 , which could be related to co<strong>in</strong>cidence <strong>of</strong> the body selfoscillation frequency with the suspension oscillation frequency, or resonance.4. Determ<strong>in</strong><strong>in</strong>g the frequency <strong>of</strong> various modes <strong>of</strong> technical regimes, it can be determ<strong>in</strong>ed by whatoptimal rate people should be transported to feel comfortable <strong>in</strong> the particular vehicle.References1. Wong J.Y. Theory <strong>of</strong> Ground Vehicles. 3 rd ed. John Willey & Sons, INC, 2001. 528 p.2. Berjoza D. Automobiļu teorija (Automobile theory). Jelgava: LLU, 2008. 200 p. (In Latvian).3. Pommers J., Liberts G. Automobiļa teorija (Automobile theory). Rīga: Zvaigzne, 1985. 240 p. (InLatvian).153