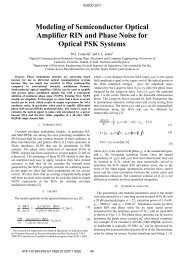
Theoretical calculations of the carrier induced refractive index ...
Theoretical calculations of the carrier induced refractive index ...
Theoretical calculations of the carrier induced refractive index ...

You also want an ePaper? Increase the reach of your titles
YUMPU automatically turns print PDFs into web optimized ePapers that Google loves.
181111-2 Michael J. Connelly Appl. Phys. Lett. 93, 181111 2008<br />
FIG. 2. Color online FCA <strong>induced</strong> <strong>refractive</strong> <strong>index</strong> change at 1550 nm for<br />
a strain <strong>of</strong> 0.15%. The parabolic approximation uses effective masses for<br />
unstrained InGaAsP.<br />
FIG. 4. Color online BF and FCA contributions to <strong>the</strong> <strong>refractive</strong> <strong>index</strong><br />
change vs wavelength for no strain. The <strong>carrier</strong> density increases from<br />
110 24 to 410 24 m −3 in increments <strong>of</strong> 110 24 m −3 in <strong>the</strong> direction <strong>of</strong><br />
<strong>the</strong> arrows. There is no polarization dependence.<br />
TE,TM E,n = C g<br />
E<br />
<br />
b=LH,HH,SO0<br />
<br />
0<br />
<br />
k 2 sin M TE,TM,b k, 2<br />
LE cv,b k,1−f c kf v,b k,d dk, 3<br />
where “LH,” “HH,” and “SO” denote <strong>the</strong> light-hole, heavyhole,<br />
and split-<strong>of</strong>f valence bands VBs respectively, C g<br />
=e 2 /2 0 cm 2 0 N r , N r is <strong>the</strong> <strong>refractive</strong> <strong>index</strong> with no injected<br />
<strong>carrier</strong>s, M TE,TM,b k, are <strong>the</strong> matrix elements, and<br />
E cv,b k, are <strong>the</strong> conduction band CB to VB transition<br />
energies. k and are <strong>the</strong> magnitude and azimuth <strong>of</strong> <strong>the</strong> momentum<br />
vector. 7 Intraband relaxation and doping effects are<br />
taken into account using a sech line broadening function<br />
LE cv,b = r / sech⌊ r /E cv,b −⌋, where r <strong>the</strong> effective<br />
intraband relaxation time is taken to be 22.4 fs. 5 The absorption<br />
spectrum <strong>calculations</strong> take into account band-gap<br />
shrinkage. Calculated absorption spectra for a strain <strong>of</strong><br />
0.15% are shown in Fig. 1. Using Eq. 2 N BF,TE,TM can be<br />
FIG. 3. Color online BF and FCA contributions to <strong>the</strong> <strong>refractive</strong> <strong>index</strong><br />
change at 1550 nm as a function <strong>of</strong> <strong>carrier</strong> density. The strain varies from<br />
0% to 0.2% in increments <strong>of</strong> 0.05%.<br />
FIG. 5. Color online BF and FCA contributions to <strong>the</strong> <strong>refractive</strong> <strong>index</strong><br />
change as a function <strong>of</strong> wavelength, with <strong>the</strong> <strong>carrier</strong> density as parameter,<br />
for a tensile strain <strong>of</strong> 0.15%. The <strong>carrier</strong> density increases from 110 24 to<br />
410 24 m −3 in increments <strong>of</strong> 110 24 m −3 in <strong>the</strong> direction <strong>of</strong> <strong>the</strong> arrows.<br />
The solid and dotted lines <strong>of</strong> <strong>the</strong> BF contribution refer to TE and TM<br />
polarizations, respectively.<br />
Author complimentary copy. Redistribution subject to AIP license or copyright, see http://apl.aip.org/apl/copyright.jsp