Laser Doppler Vibrometry System using the Synthetic-Heterodyne ...
Laser Doppler Vibrometry System using the Synthetic-Heterodyne ...
Laser Doppler Vibrometry System using the Synthetic-Heterodyne ...

Create successful ePaper yourself
Turn your PDF publications into a flip-book with our unique Google optimized e-Paper software.
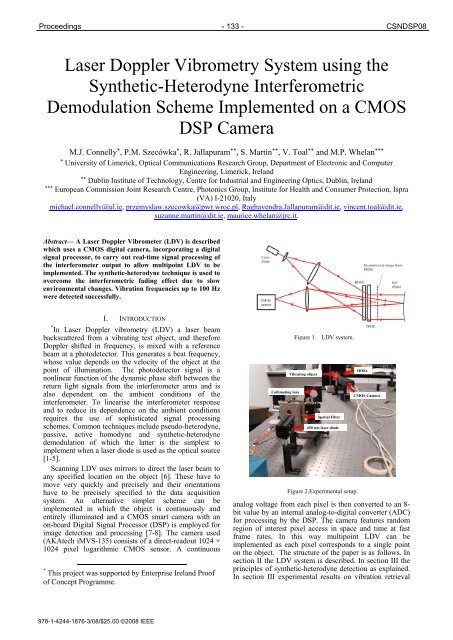
Proceedings - 133 - CSNDSP08<strong>Laser</strong> <strong>Doppler</strong> <strong>Vibrometry</strong> <strong>System</strong> <strong>using</strong> <strong>the</strong>Syn<strong>the</strong>tic-<strong>Heterodyne</strong> InterferometricDemodulation Scheme Implemented on a CMOSDSP CameraM.J. Connelly * , P.M. Szecówka * , R. Jallapuram ** , S. Martin ** , V. Toal ** and M.P. Whelan ****University of Limerick, Optical Communications Research Group, Department of Electronic and ComputerEngineering, Limerick, Ireland**Dublin Institute of Technology, Centre for Industrial and Engineering Optics, Dublin, Ireland***European Commission Joint Research Centre, Photonics Group, Institute for Health and Consumer Protection, Ispra(VA) I-21020, Italymichael.connelly@ul.ie, przemyslaw.szecowka@pwr.wroc.pl, Raghavendra.Jallapuram@dit.ie, vincent.toal@dit.ie,suzanne.martin@dit.ie, maurice.whelan@jrc.it.Abstract— A <strong>Laser</strong> <strong>Doppler</strong> Vibrometer (LDV) is describedwhich uses a CMOS digital camera, incorporating a digitalsignal processor, to carry out real-time signal processing of<strong>the</strong> interferometer output to allow multipoint LDV to beimplemented. The syn<strong>the</strong>tic-heterodyne technique is used toovercome <strong>the</strong> interferometric fading effect due to slowenvironmental changes. Vibration frequencies up to 100 Hzwere detected successfully.I. INTRODUCTION* In <strong>Laser</strong> <strong>Doppler</strong> vibrometry (LDV) a laser beambackscattered from a vibrating test object, and <strong>the</strong>refore<strong>Doppler</strong> shifted in frequency, is mixed with a referencebeam at a photodetector. This generates a beat frequency,whose value depends on <strong>the</strong> velocity of <strong>the</strong> object at <strong>the</strong>point of illumination. The photodetector signal is anonlinear function of <strong>the</strong> dynamic phase shift between <strong>the</strong>return light signals from <strong>the</strong> interferometer arms and isalso dependent on <strong>the</strong> ambient conditions of <strong>the</strong>interferometer. To linearise <strong>the</strong> interferometer responseand to reduce its dependence on <strong>the</strong> ambient conditionsrequires <strong>the</strong> use of sophisticated signal processingschemes. Common techniques include pseudo-heterodyne,passive, active homodyne and syn<strong>the</strong>tic-heterodynedemodulation of which <strong>the</strong> latter is <strong>the</strong> simplest toimplement when a laser diode is used as <strong>the</strong> optical source[1-5].Scanning LDV uses mirrors to direct <strong>the</strong> laser beam toany specified location on <strong>the</strong> object [6]. These have tomove very quickly and precisely and <strong>the</strong>ir orientationshave to be precisely specified to <strong>the</strong> data acquisitionsystem. An alternative simpler scheme can beimplemented in which <strong>the</strong> object is continuously andentirely illuminated and a CMOS smart camera with anon-board Digital Signal Processor (DSP) is employed forimage detection and processing [7-8]. The camera used(AKAtech iMVS-135) consists of a direct-readout 1024 ×1024 pixel logarithmic CMOS sensor. A continuous* This project was supported by Enterprise Ireland Proofof Concept Programme.Collimating lensFigure 1. LDV system.Vibrating objectSpatial Filter650 nm laser diodeFigure 2.Experimental setup.HOEsCMOS Cameraanalog voltage from each pixel is <strong>the</strong>n converted to an 8-bit value by an internal analog-to-digital converter (ADC)for processing by <strong>the</strong> DSP. The camera features randomregion of interest pixel access in space and time at fastframe rates. In this way multipoint LDV can beimplemented as each pixel corresponds to a single pointon <strong>the</strong> object. The structure of <strong>the</strong> paper is as follows. Insection II <strong>the</strong> LDV system is described. In section III <strong>the</strong>principles of syn<strong>the</strong>tic-heterodyne detection as explained.In section III experimental results on vibration retrieval978-1-4244-1876-3/08/$25.00 ©2008 IEEE
CSNDSP08 - 134 - Proceedingsand analysis are presented and in section IV someconclusions are presented.II. LDV SYSTEMA schematic diagram of <strong>the</strong> LDV system isschematically shown in Fig. 1 and <strong>the</strong> experimental setupis shown in Fig. 2. The light from a laser diode iscollimated and illuminates a reflection holographic opticalelement (RHOE) and a transmissive HOE. The RHOEreconstructs <strong>the</strong> beam of light originally scattered from adiffusely reflecting surface, to act as a reference beam.The RHOE efficiency of 50% allows <strong>the</strong> transmission of<strong>the</strong> remaining incident light. The reflected light from <strong>the</strong>vibrating object is efficiently transmitted through <strong>the</strong> twoHOEs and interferes with <strong>the</strong> reference beam at <strong>the</strong>CMOS camera. More details on <strong>the</strong> HOEs can be found in[9]. The detected light signal is <strong>the</strong>n processed by <strong>the</strong>camera DSP to retrieve <strong>the</strong> vibration signal.III.SYNTHETIC-HETERODYNE INTERFEROMETRICDEMODULATION THEORYThe detected photocurrent from a two-beaminterferometer can be written asI() t A[ 1 + V cosθ( t)]= (1)The constant A is proportional to <strong>the</strong> optical power of <strong>the</strong>detected light beams and <strong>the</strong> mixing efficiency of <strong>the</strong>detector and V is <strong>the</strong> interferometer visibility. θ (t)is<strong>the</strong> phase difference between <strong>the</strong> arms of <strong>the</strong>interferometer. A typical plot of (1) is shown in Fig. 3.The sensitivity of <strong>the</strong> interferometer is maximized when<strong>the</strong> mean phase difference between <strong>the</strong> detected lightbeams is an odd integer multiple of π/2. When this is <strong>the</strong>case <strong>the</strong> interferometer is said to be operating inquadrature.drive current. The resulting laser frequency modulation isconverted to phase modulation by <strong>the</strong> non-zero cavity pathdifference of <strong>the</strong> interferometer. It can <strong>the</strong>n be shown that[10]I( t) A{ 1 + V cos[ C cos( ω0t)+ φ(t)]}= (2)where φ(t)contains <strong>the</strong> signal of interest and slowenvironmental effects. The most important effect istemperature variations that cause refractive index changesin <strong>the</strong> interferometer, which leads to <strong>the</strong> interferometerdrifting in and out of quadrature. If <strong>the</strong> single-mode laserdiode is modulated with a small-signal sinusoidal currentof amplitude I m<strong>the</strong>ndνC ≈ 2πImτdI(3)dν dI and τ are <strong>the</strong> differential of <strong>the</strong> laserwhereoptical frequency with respect to <strong>the</strong> applied current and<strong>the</strong> average time difference between <strong>the</strong> interferometerarms respectively. Typical values of dν dI are in <strong>the</strong>range of a 100s of MHz/mA for conventional Fabry-Perotlaser diodes [11] . (2) can be expanded into a series ofsidebands at integer multiples of ω 0that contain <strong>the</strong>signal of interest φ (t). In syn<strong>the</strong>tic-heterodynedemodulation, <strong>the</strong> first two sidebands of (2) are mixedwith in-phase local oscillators at ω0and 2ω0and lowpassfiltered to giveSS12= AVJ1(C)sinφ(t)= AVJ ( C)cosφ(t)2(4)where J1and J2are Bessel functions of <strong>the</strong> first kind oforder one and two respectively. Taking <strong>the</strong> timederivatives of S1and S2givesSS34= AVJ1(C)& φ(t)cosφ(t)= −AVJ( C)& φ(t)sinφ(t)2(5)Figure 3. Typical two-beam interferometer transfer function.Multiplying S1by S4and S2by S3givesSS5622( AV ) J1(C)J2( C)& φ(t)sinφ(t22( AV ) J ( C)J ( C)& φ(t)cosφ(t)= −=12)(6)In <strong>the</strong> syn<strong>the</strong>tic-heterodyne technique a sinusoidalmodulation with frequency ω0and amplitude C isimposed on <strong>the</strong> interferometer. In this work <strong>the</strong>modulation is carried out by modulating <strong>the</strong> laser diodefrequency via sinusoidal amplitude modulation of <strong>the</strong> laserSubtracting S5from S6givesS o2( AV ) J C)J ( C)dφdt= (7)1 ( 2
Proceedings - 135 - CSNDSP08dφ dt is proportional to <strong>the</strong> object velocity and isessentially immune to slow environmental fluctuations.Sodepends on <strong>the</strong> product J1( C)J2(C), which has itsmaximum value of 0.22 when C = 2.37. This conditiondictates <strong>the</strong> magnitude of <strong>the</strong> modulation current used fora given laser and cavity length.IV. VIBRATION RETRIEVAL AND ANALYSISIn <strong>the</strong> experiment, <strong>the</strong> current driving a 650 nm Fabry-Perot laser diode was sinusoidally modulated at 1 kHz.The modulation amplitude was chosen such that C is in<strong>the</strong> range of its optimum value of 2.37 for <strong>the</strong> choseninterferometer path difference of 10 cm. A block diagramof <strong>the</strong> syn<strong>the</strong>tic-heterodyne demodulation technique asimplemented on <strong>the</strong> camera DSP is shown in Fig. 4. Thesignal processing was implemented on <strong>the</strong> camera <strong>using</strong><strong>the</strong> camera development software, which allows <strong>the</strong>algorithm to be created in C before compiling anddownloading to <strong>the</strong> camera DSP. The camera was alsointerfaced to a PC running customised software forsubsequent analysis and display of <strong>the</strong> retrieved vibrationsignal.ADC limits can be optimised to cover <strong>the</strong> incoming lightrange for a maximum visibility over <strong>the</strong> 255 grey digitallevels available.The ADC output is linearised by taking its exponentialbefore being processed <strong>using</strong> <strong>the</strong> syn<strong>the</strong>tic-heterodynedemodulation. The sampling rate of <strong>the</strong> ADC and <strong>the</strong>vibration spectrum of <strong>the</strong> object under test are such thataliasing is not present. For test purposes <strong>the</strong> vibratingobject used was a metal plate mounted on a piezoelectrictransducer (PZT) driven by a signal generator. The camerawas focused on to <strong>the</strong> object to obtain a sharp imagewhich was monitored on a computer screen. Individualcamera pixels with good amplitude modulation wereFigure 6. Customised PC software showing <strong>the</strong> demodulationalgorithm settings and <strong>the</strong> retrieved 100 Hz vibration spectrum at asingle pixel corresponding to a particular point on <strong>the</strong> vibratingobject. Because of <strong>the</strong> limited frequency resolution of <strong>the</strong> signalprocessing <strong>the</strong> detected frequency is 97.7 Hz.Figure 4.Block diagram of <strong>the</strong> syn<strong>the</strong>tic-heterodyne demodulationscheme as implemented on <strong>the</strong> DSP cameraFigure 5. 100 Hz retrieved vibration signal (upper trace) and <strong>the</strong>drive signal applied to <strong>the</strong> plate (lower trace).In <strong>the</strong> camera <strong>the</strong> detected light signal from <strong>the</strong> chosenpixel is amplified by a logarithmic CMOS circuit and <strong>the</strong>ndigitised by <strong>the</strong> ADC. The amplifier gain parameters andselected and analysed.A typical example of a successfully retrieved syn<strong>the</strong>ticheterodynedemodulated 100 Hz vibration signal is shownin Fig. 5. Previous work we have carried out on syn<strong>the</strong>ticheterodynedemodulation indicates that <strong>the</strong> noise presentin <strong>the</strong> detected signal is primarily due to quantizationnoise caused by <strong>the</strong> ADC. The noise also possiblycontains subharmonics of signal of interest. This occursdue to <strong>the</strong> non-linear nature of <strong>the</strong> demodulation algorithmand is especially prevalent when <strong>the</strong> vibration signal islarge.The power spectrum, obtained <strong>using</strong> a fast Fouriertransform, of <strong>the</strong> retrieved vibration signal is shown inFig. 6. Some instability was experienced because <strong>the</strong> sidemoderejection ratio of <strong>the</strong> Fabry-Perot laser was onlyapproximately 7 dB. In addition, although <strong>the</strong> lasertemperature was carefully controlled, <strong>the</strong> laser was stillprone to mode-hopping. It was not possible to determine<strong>the</strong> minimum magnitude of vibration that can be detected.This will be <strong>the</strong> subject of future work. It will depend on<strong>the</strong> laser linewidth, <strong>the</strong> pixel noise and in particularquantization noise due to <strong>the</strong> ADC [10].A much improved performance would be expectedfrom a single-wavelength laser such as a distributedfeedback laser although such lasers are difficult to sourcein <strong>the</strong> 650 nm region. Our current work involvesextending <strong>the</strong> wavelength range of <strong>the</strong> HOEs to <strong>the</strong> 730nm region, where DFB lasers are readily available.
CSNDSP08 - 136 - ProceedingsV. CONCLUSIONSA simple out-of-plane multipoint LDV systemincorporating HOEs and a CMOS DSP camera was shownto be able to detect vibration signals at frequencies up to100 Hz from a vibrating surface. The CMOS DSP cameraallows for random pixel access <strong>the</strong>reby enabling <strong>the</strong> userto examine particular regions of interest on <strong>the</strong> vibratingsurface. Improvements in <strong>the</strong> stability of <strong>the</strong> processedsignal can be expected by <strong>using</strong> a more stable laser.REFERENCES[1] D.A. Jackson, A.D Kersey, M. Corke M and J.D. Jones, “Pseudoheterodynedetection scheme for optical interferometers,”Electron. Lett., vol. 18, pp. 1081–3, 1982.[2] A. Dandridge, A.B. Tveten and T. Giallorenzi, “Homodynedemodulation scheme for fiber optic sensors <strong>using</strong> phasegenerated carrier,” IEEE J. Quantum Electron., vol. 18 pp. 1647–62, 1982.[3] J.H. Cole, B.A. Danver and J.A. Bucaro, “Syn<strong>the</strong>tic-heterodyneinterferometric demodulation,” IEEE J. Quantum Electron., vol 18pp. 694–7, 1982.[4] B. Griffin and M.J. Connelly, “Interferometric fiber optic sensorinterrogation system <strong>using</strong> digital signal processing and syn<strong>the</strong>ticheterodynedetection,” 17th International Conference on OpticalFibre Sensors, Proceedings of SPIE., vol. 5885, pp. 619-622,2005.[5] M. Holzer and F. Mohr, “Aspects of signal processing in laservibrometry and <strong>the</strong>ir embedded-realisation on FPGA with NI-LabVIEW,“ 17th International Conference Radioelektronika,2007.[6] P. Castellini, G.M. Revel and E.P. Tomasini, “<strong>Laser</strong> <strong>Doppler</strong>vibrometry: a review of advances and applications,” The ShockVibr. Dig., vol. 30, pp. 443-456, 1998.[7] P. Egan, M.J. Connelly, F. Lakestani and M.P. Whelan, “Randomdepth access full-field heterodyne low coherence interferometryutilizing acousto-optic modulation and a complementary metaloxidesemiconductor camera,” Optic Lett. vol. 31, pp. 912-914,2006.[8] P. Egan, F. Lakestani, M. P. Whelan and M.J. Connelly, “Fullfieldoptical coherence tomography with a CMOS-DSP camera,”Opt. Eng., vol. 45, pp. 015601-6, 2006.[9] M.J. Connelly, P. Szecowka, R. Jallapuram, S. Martin, V. Toaland M.P. Whelan, “Multipoint laser <strong>Doppler</strong> vibrometry <strong>using</strong>holographic optical elements and a CMOS digital camera,” Opt.Lett., vol. 33, pp, 330-332, 2008.[10] M.J. Connelly, “Digital syn<strong>the</strong>tic-heterodyne interferometricdemodulation,” J. Opt. A: Pure and Applied Optics, vol. 4, pp.400-405, 2002.[11] Characterisation data on Hitachi Fabry-Perot laser diodeswww.photonic-products.com/techinfo/hitachi_tech/opd_databook_mar031.pdf