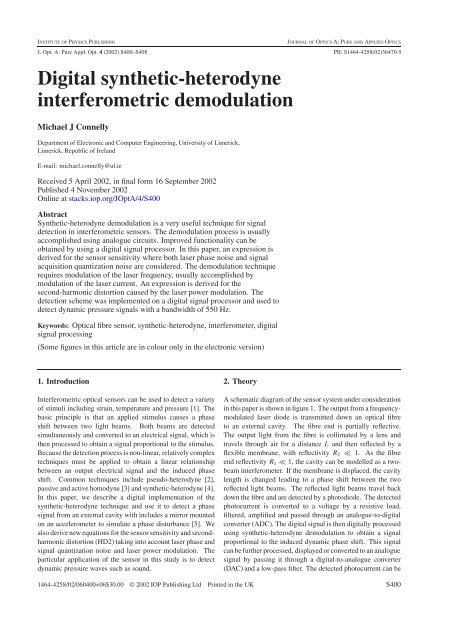
Digital synthetic-heterodyne interferometric demodulation
Digital synthetic-heterodyne interferometric demodulation
Digital synthetic-heterodyne interferometric demodulation

Create successful ePaper yourself
Turn your PDF publications into a flip-book with our unique Google optimized e-Paper software.
MJConnellyModulation currenti( t)= Imcos ω0tDFB laserdc biasI(t)Bias-teeIsolatorOpticalreceiverSplitterOptical fibre<strong>Digital</strong>signalprocessingExtrinsic cavityR 2R 1PressurewaveLensFlexibleL mirrorOutput signalproportional todynamic pressureFigure 1. Dynamic pressure sensor system using <strong>synthetic</strong> <strong>heterodyne</strong> <strong>demodulation</strong>.XFIR low-passfilterFromopticalreceiverAmplifierAnti-aliasingfilterADCCos(w t)0Cos(2w t) 0XFIR low-passfilterddtddtXX+ IntegratorResetswitchAmplifierRange checkDACAnalogoutputto low-passfilter0Figure 2. Synthetic-<strong>heterodyne</strong> <strong>demodulation</strong> digital implementation.τ c is related to the laser spectral linewidth ν byτ c = 1ν . (19)The quantization noise current spectral density is given by( VA–D/2 Q) 2G q =6T s R 2 (20)Lwhere V A–D and Q are the voltage range and number of bits ofthedigitalsignal processor input ADC. T s is the sampling time(inverse of the sampling frequency). In (20) it is assumed thatunity strength sampling pulses are used in the ADC quantizer.The total current noise spectral density η (single-sided) atthe ADC input is simply the sum of the individual uncorrelatednoise spectral densities, i.e.η = G th + G p + G q . (21)η can be considered to be white noise over the bandwidth ofthe detection process. It is an elementary but tedious process,using techniques described in [7], to calculate the output noisepower N after<strong>synthetic</strong>-<strong>heterodyne</strong> <strong>demodulation</strong>. We simplystate the result here:N = [AV J 2(C)] 2 ηB. (22)23.2. Output signal powerIf the input phase signal φ(t) is sinusoidal with amplitude Dandangular frequency ω s ,thenthe detected signalpower,afterintegration of S 0 ,isgivenbyS = (AV)4 [DJ 1 (C)J 2 (C)] 2. (23)2The sensor signal-to-noise ratio (SNR), from (22) and (23) isgiven bySNR ≡ S N = [AV J 1(C)D] 2. (24)ηBThe sensor sensitivity can be defined as the phase amplitudeD min required for an SNR of unity. From (24) we get√ ηD min =rad Hz −1/2 . (25)AV J 1 (C)If laser phase noise induced intensity noise is dominant, thenD min is proportional to the cavity length.4. Second-harmonic distortionThe laser power varies as the current is modulated. This cancause phase errors [8]. In <strong>synthetic</strong>-<strong>heterodyne</strong> <strong>demodulation</strong>,S402
<strong>Digital</strong> <strong>synthetic</strong>-<strong>heterodyne</strong> <strong>interferometric</strong> <strong>demodulation</strong>2.4 kHz localoscillatorS 2S 34.8 kHz localoscillatorS 4Input toupper filterS 1 x S 4Input tolower filterS 2 x S 3S 1S oFigure 3. Internal signals on the DSP card. The vertical axes are normalized to the maximum signal amplitudes for clarity. The lengths ofthe horizontal time axes are 20 ms.Acquired optical receiver signalDetected phase signal at 100 HzFigure 4. Optical receiver output and detected phase signals. The ramping ofthe phase signal is due to the laser power modulation. Thevertical axes are normalized to the maximum signal amplitudes for clarity. The lengths of the left and right horizontal time axes are 7 and29 ms respectively.thelaser power variation causes terms proportional to cos φ(t)and sin φ(t) to be present in S 1 and S 2 respectively andalso terms proportional to ˙φ(t) sin φ(t) and ˙φ(t) cos φ(t) tobe present in S 3 and S 4 respectively. An advantage ofthe <strong>synthetic</strong>-<strong>heterodyne</strong> technique is that these potentiallydegrading terms cancel out when S 0 is calculated. There is alsoaconstant term in S 1 , caused bythe laser power modulation.If this effect is included in the analysis then (14) becomes[]S 0 = (AV) 2 αJ 1 (C)J 2 (C) ˙φ(t) 1 −2V J 1 (C) sin φ(t)(26)whereα = dP in I m. (27)dI P inIf φ(t) = D cos(ωt) is small compared to unity then (26)becomesS 0 =−(AV) 2 J 1 (C)J 2 (C)ωD sin(ωt)[]α× 1 −2V J 1 (C) D cos(ωt)=−(AV) 2 J 1 (C)J 2 (C)ωD{}α× sin(ωt) −4V J 1 (C) [1 + sin(2ωt)] . (28)S403
MJConnellyIf S 0 is integrated (to retrieve φ(t)) thenthe constant termin (28) will give rise to a signal that increases linearly with time.There is also a second harmonic present in (28), which mayinterfere with other signals within the <strong>demodulation</strong> schemedetection bandwidth. The HD2 can be defined as the ratiobetween the amplitudes of the fundamental and its secondharmonic, i.e.[2HD = 20 logαD8V J 1 (C)5. <strong>Digital</strong> implementation and experiment]dB. (29)The basic experimental setup is shown in figure 1. A blockdiagram of the <strong>synthetic</strong>-<strong>heterodyne</strong> <strong>demodulation</strong> techniqueas implemented on a digital signal processor (dSPACEDS1102) is shown in figure 2. The output signal from theoptical receiver (R L = 1k) ispassedthrough a dc blockingcapacitor, anti-aliasing filter (bandwidth equal to ω 0 /π + B),amplified (so the receiver output signal range is equal to theADC voltage range) and converted to a digital signal. Thedigital signal is then processed using <strong>synthetic</strong>-<strong>heterodyne</strong><strong>demodulation</strong>. The DSP card has a 16-bit ADC and operates atasampling frequency of 12 kHz. The digital filters are finiteimpulseresponse (FIR) filters. Differentiation is approximatedbyd f (t)dt≈ ( f n − f n−1 )T s(30)where f n and f n−1 are samples of a function f at times t andt + T s .Integration is approximated by∫n∑f (t) dt ≈ T s f j . (31)Due tothe laser power modulation, there is a dc componentin the signal prior to integration. This will eventually causean overflow error in the processor. To avoid this problem,the integrator output is reset to zero if it exceeds its allowedrange. If required, the demodulated phase signal can be furtherprocessed or converted to an analogue signal using a DAC andsmoothing low-pass filter.Aprototype system was constructed using a temperaturestabilizedDFB laser operating at a bias current of 90 mA, withan output power of 1 mW. The side-mode rejection ratio of thelaser was greater than 35 dB and so is a monomode source.At the bias point chosen, dν/dI = 850 MHz mA −1 .A10cmlong external cavity was used. An external low-reflectivitymirror mounted on an accelerometer was used to simulate aflexible reflective membrane. For evaluation purposes, theaccelerometer was driven by a sinusoidal voltage at 100 Hzto simulate a cavity displacement. The laser modulationcurrent had a frequency of 2.4 kHz. The current amplitudeof 3.6 mA was chosen to give the optimum value of C (2.37)for the particular cavity length used. The fibre uncoatedcleaved end reflectivity is 0.04. The mirror has a reflectivityapproximately equal to 0.1. γ = 1. A low-noise opticalreceiver (R p = 0.9AW −1 )wasused to detect the return signalfrom the external cavity. This signal was then passed throughan anti-aliasing filter, dc blocking capacitor and amplifiedbefore acquisition and digital signal processing. Software wasj=0written that allows the internal DSP signals to be monitored.Some of these signals are shown in figure 3. The opticalreceiver output signal and resulting detected phase signal at100 Hz are shown in figure 4. The phase signal is as expected,asinusoid at 100 Hz. The waveform exhibits sharp jumpsthat are due to quantization effects inherent in the samplingprocess. These can be removed if the signal is converted toan analogue signal and passed through a smoothing low-passfilter. The waveform also has a component that increasesslowly with time. As described above, this is caused bythe laser power modulation. In this case phase resets wererequired approximately every 5 s, i.e. the reset waveform isatriangular function with a period of 5 s. This means thatthe lowest frequency that can be detected by the sensor isapproximately 1 Hz (assuming frequency components abovethe fifth harmonic of the reset waveform are negligible). Otherfrequencies, within the detection bandwidth of 550 Hz, weresuccessfully detected.The thermal noise limited sensitivity is 0.2 µrad Hz −1/2 .If a typical laser linewidth of 10 MHz is assumed, thetheoretical sensitivity (in the absence of quantization noise)from (25) is 7.8 µrad Hz −1/2 . The quantization noiceintroduced by the 16-bit ADC is for the dominant noise source,leading to a theoretical sensitivity of 0.49 rad Hz −1/2 . Thistheoretical sensitivity was not confirmed experimentally in theprototype system. The quantization noise can be reduced toless than the laser phase noise induced intensity noise by the useof a 32-bit ADC. There is some distortion of the output signal;however, it was difficult to determine if this is due to additionalreflections from the cavity, the laser power modulation or theaccelerometer.6. ConclusionsAprototype of a digital implementation of the <strong>synthetic</strong><strong>heterodyne</strong>technique, with a detection bandwidth of 550 Hz,has been demonstrated. Important practical limitations,including laser phase noise, signal quantization noise, laserpower modulation and second harmonic distortion wereanalysed.AcknowledgmentThis work was carried out while the author was a visitingresearcher at the European Commission Joint Research Centre(JRC), 21020 Ispra (VA), Italy. The author thanks Dr MauriceWhelan of the JRC for assistance with the experimental set-upand useful discussions.References[1] Giallorenzi T G, Bucaro J A, Dandridge A, Siegel G H,Cole J H, Raleigh S C and Priest R G 1982 Optical fibersensor technology IEEE J. Quantum Electron. 18 625–65[2] Jackson D A, Kersey A D, Corke M and Jones J D 1982Pseudo-<strong>heterodyne</strong> detection scheme for opticalinterferometers Electron. Lett. 18 1081–3[3] Dandridge A, Tveten A B and Giallorenzi T G 1982 Homodyne<strong>demodulation</strong> scheme for fiber optic sensors using phasegenerated carrier IEEE J. Quantum Electron. 18 1647–62[4] Cole J H, Danver B A and Bucaro J A 1982Synthetic-<strong>heterodyne</strong> <strong>interferometric</strong> <strong>demodulation</strong> IEEE J.Quantum Electron. 18 694–7S404
<strong>Digital</strong> <strong>synthetic</strong>-<strong>heterodyne</strong> <strong>interferometric</strong> <strong>demodulation</strong>[5] Connelly M J and Whelan M 2001 Analysis of digital<strong>synthetic</strong>-<strong>heterodyne</strong> detection of a fibre cavity sensor Proc.3rd Topical Meeting on Optoelectronic DistanceMeasurement and Applications, ODIMAP III (Pavia, Italy)pp 331–6[6] Petermann K and Weidel E 1981 Semiconductor laser noise inan interferometer system IEEE J. Quantum Electron.17 1251–6[7] Taub H and Schilling D L 1987 Principles of CommunicationSystems (New York: McGraw-Hill)[8] Onodera R, Ishii Y, Ohde N, Takahashi Y and Yoshino T 1995Effect of laser-diode power change on optical <strong>heterodyne</strong>interferometry IEEE J. Lightwave Technol.13 675–81S405