


Create successful ePaper yourself
Turn your PDF publications into a flip-book with our unique Google optimized e-Paper software.
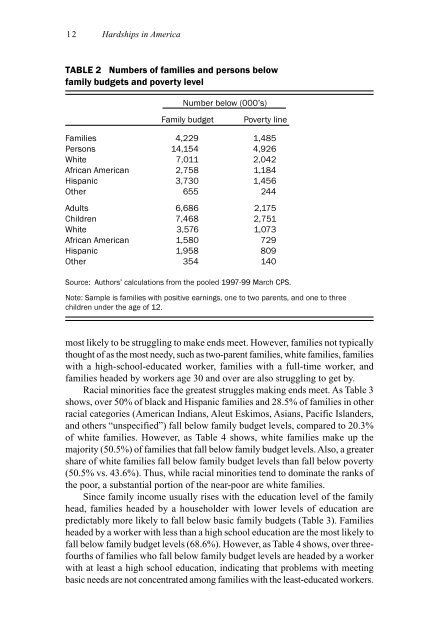
12 Hardships in America<br />
TABLE 2 Numbers of families and persons below<br />
family budgets and poverty level<br />
Number below (000’s)<br />
Family budget<br />
Poverty line<br />
Families 4,229 1,485<br />
Persons 14,154 4,926<br />
White 7,011 2,042<br />
African American 2,758 1,184<br />
Hispanic 3,730 1,456<br />
Other 655 244<br />
Adults 6,686 2,175<br />
Children 7,468 2,751<br />
White 3,576 1,073<br />
African American 1,580 729<br />
Hispanic 1,958 809<br />
Other 354 140<br />
Source: Authors’ calculations from the pooled 1997-99 March CPS.<br />
Note: Sample is families with positive earnings, one to two parents, and one to three<br />
children under the age of 12.<br />
most likely to be struggling to make ends meet. However, families not typically<br />
thought of <strong>as</strong> the most needy, such <strong>as</strong> two-parent families, white families, families<br />
with a high-school-educated worker, families with a full-time worker, and<br />
families headed by workers age 30 and over are also struggling to get by.<br />
Racial minorities face the greatest struggles making ends meet. As Table 3<br />
shows, over 50% of black and Hispanic families and 28.5% of families in other<br />
racial categories (American Indians, Aleut Eskimos, Asians, Pacific Islanders,<br />
and others “unspecified”) fall below family budget levels, compared to 20.3%<br />
of white families. However, <strong>as</strong> Table 4 shows, white families make up the<br />
majority (50.5%) of families that fall below family budget levels. Also, a greater<br />
share of white families fall below family budget levels than fall below poverty<br />
(50.5% vs. 43.6%). Thus, while racial minorities tend to dominate the ranks of<br />
the poor, a substantial portion of the near-poor are white families.<br />
Since family income usually rises with the education level of the family<br />
head, families headed by a householder with lower levels of education are<br />
predictably more likely to fall below b<strong>as</strong>ic family budgets (Table 3). Families<br />
headed by a worker with less than a high school education are the most likely to<br />
fall below family budget levels (68.6%). However, <strong>as</strong> Table 4 shows, over threefourths<br />
of families who fall below family budget levels are headed by a worker<br />
with at le<strong>as</strong>t a high school education, indicating that problems with meeting<br />
b<strong>as</strong>ic needs are not concentrated among families with the le<strong>as</strong>t-educated workers.
