


You also want an ePaper? Increase the reach of your titles
YUMPU automatically turns print PDFs into web optimized ePapers that Google loves.
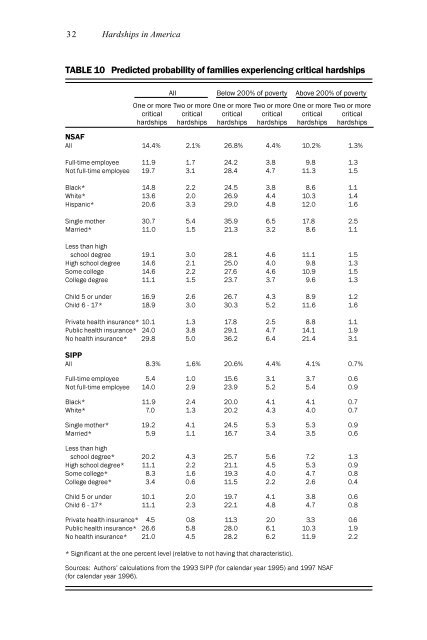
32 Hardships in America<br />
TABLE 10 Predicted probability of families experiencing critical hardships<br />
All Below 200% of poverty Above 200% of poverty<br />
One or more Two or more One or more Two or more One or more Two or more<br />
critical critical critical critical critical critical<br />
hardships hardships hardships hardships hardships hardships<br />
NSAF<br />
All 14.4% 2.1% 26.8% 4.4% 10.2% 1.3%<br />
Full-time employee 11.9 1.7 24.2 3.8 9.8 1.3<br />
Not full-time employee 19.7 3.1 28.4 4.7 11.3 1.5<br />
Black*14.8 2.2 24.5 3.8 8.6 1.1<br />
White*13.6 2.0 26.9 4.4 10.3 1.4<br />
Hispanic*20.6 3.3 29.0 4.8 12.0 1.6<br />
Single mother 30.7 5.4 35.9 6.5 17.8 2.5<br />
Married*11.0 1.5 21.3 3.2 8.6 1.1<br />
Less than high<br />
school degree 19.1 3.0 28.1 4.6 11.1 1.5<br />
High school degree 14.6 2.1 25.0 4.0 9.8 1.3<br />
Some college 14.6 2.2 27.6 4.6 10.9 1.5<br />
College degree 11.1 1.5 23.7 3.7 9.6 1.3<br />
Child 5 or under 16.9 2.6 26.7 4.3 8.9 1.2<br />
Child 6 - 17*18.9 3.0 30.3 5.2 11.6 1.6<br />
Private health insurance*10.1 1.3 17.8 2.5 8.8 1.1<br />
Public health insurance*24.0 3.8 29.1 4.7 14.1 1.9<br />
No health insurance*29.8 5.0 36.2 6.4 21.4 3.1<br />
SIPP<br />
All 8.3% 1.6% 20.6% 4.4% 4.1% 0.7%<br />
Full-time employee 5.4 1.0 15.6 3.1 3.7 0.6<br />
Not full-time employee 14.0 2.9 23.9 5.2 5.4 0.9<br />
Black*11.9 2.4 20.0 4.1 4.1 0.7<br />
White*7.0 1.3 20.2 4.3 4.0 0.7<br />
Single mother*19.2 4.1 24.5 5.3 5.3 0.9<br />
Married*5.9 1.1 16.7 3.4 3.5 0.6<br />
Less than high<br />
school degree*20.2 4.3 25.7 5.6 7.2 1.3<br />
High school degree*11.1 2.2 21.1 4.5 5.3 0.9<br />
Some college*8.3 1.6 19.3 4.0 4.7 0.8<br />
College degree*3.4 0.6 11.5 2.2 2.6 0.4<br />
Child 5 or under 10.1 2.0 19.7 4.1 3.8 0.6<br />
Child 6 - 17*11.1 2.3 22.1 4.8 4.7 0.8<br />
Private health insurance*4.5 0.8 11.3 2.0 3.3 0.6<br />
Public health insurance*26.6 5.8 28.0 6.1 10.3 1.9<br />
No health insurance*21.0 4.5 28.2 6.2 11.9 2.2<br />
* Significant at the one percent level (relative to not having that characteristic).<br />
Sources: Authors’ calculations from the 1993 SIPP (for calendar year 1995) and 1997 NSAF<br />
(for calendar year 1996).
