


You also want an ePaper? Increase the reach of your titles
YUMPU automatically turns print PDFs into web optimized ePapers that Google loves.
30 Hardships in America<br />
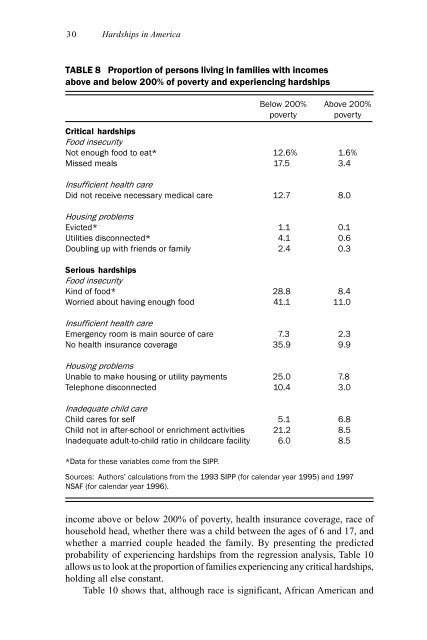
TABLE 8 Proportion of persons living in families with incomes<br />
above and below 200% of poverty and experiencing hardships<br />
Below 200% Above 200%<br />
poverty poverty<br />
Critical hardships<br />
Food insecurity<br />
Not enough food to eat* 12.6% 1.6%<br />
Missed meals 17.53.4<br />
Insufficient health care<br />
Did not receive necessary medical care 12.7 8.0<br />
Housing problems<br />
Evicted* 1.1 0.1<br />
Utilities disconnected* 4.1 0.6<br />
Doubling up with friends or family 2.4 0.3<br />
Serious hardships<br />
Food insecurity<br />
Kind of food* 28.8 8.4<br />
Worried about having enough food 41.1 11.0<br />
Insufficient health care<br />
Emergency room is main source of care 7.3 2.3<br />
No health insurance coverage 35.9 9.9<br />
Housing problems<br />
Unable to make housing or utility payments 25.0 7.8<br />
Telephone disconnected 10.4 3.0<br />
Inadequate child care<br />
Child cares for self 5.1 6.8<br />
Child not in after-school or enrichment activities 21.2 8.5<br />
Inadequate adult-to-child ratio in childcare facility 6.0 8.5<br />
*Data for these variables come from the SIPP.<br />
Sources: Authors’ calculations from the 1993 SIPP (for calendar year 1995) and 1997<br />
NSAF (for calendar year 1996).<br />
income above or below 200% of poverty, health insurance coverage, race of<br />
household head, whether there w<strong>as</strong> a child between the ages of 6 and 17, and<br />
whether a married couple headed the family. By presenting the predicted<br />
probability of experiencing hardships from the regression analysis, Table 10<br />
allows us to look at the proportion of families experiencing any critical hardships,<br />
holding all else constant.<br />
Table 10 shows that, although race is significant, African American and
