


You also want an ePaper? Increase the reach of your titles
YUMPU automatically turns print PDFs into web optimized ePapers that Google loves.
34 Hardships in America<br />
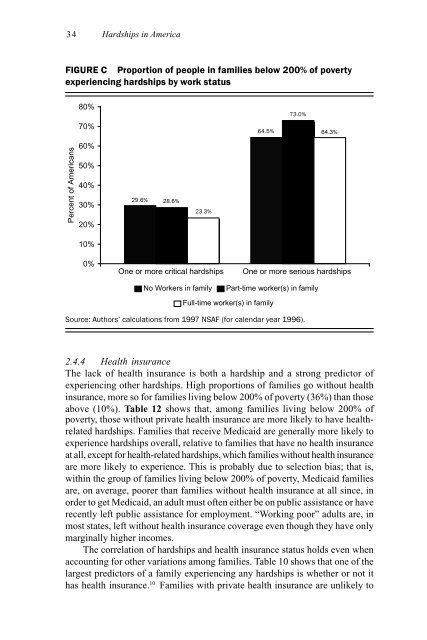
FIGURE C Proportion of people in families below 200% of poverty<br />
experiencing hardships by work status<br />
80%<br />
70%<br />
0.6446 64.5%<br />
0.7297 73.0%<br />
0.6429 64.3%<br />
Percent of Americans<br />
60%<br />
50%<br />
40%<br />
30%<br />
20%<br />
0.2964 29.6% 0.2861 28.6%<br />
0.2336 23.3%<br />
10%<br />
0%<br />
One or more critical hardships<br />
One or more serious hardships<br />
No Workers in family Part-time worker(s) in family<br />
Full-time worker(s) in family<br />
Source: Authors’ calculations from 1997 NSAF (for calendar year 1996).<br />
2.4.4 Health insurance<br />
The lack of health insurance is both a hardship and a strong predictor of<br />
experiencing other hardships. High proportions of families go without health<br />
insurance, more so for families living below 200% of poverty (36%) than those<br />
above (10%). Table 12 shows that, among families living below 200% of<br />
poverty, those without private health insurance are more likely to have healthrelated<br />
hardships. Families that receive Medicaid are generally more likely to<br />
experience hardships overall, relative to families that have no health insurance<br />
at all, except for health-related hardships, which families without health insurance<br />
are more likely to experience. This is probably due to selection bi<strong>as</strong>; that is,<br />
within the group of families living below 200% of poverty, Medicaid families<br />
are, on average, poorer than families without health insurance at all since, in<br />
order to get Medicaid, an adult must often either be on public <strong>as</strong>sistance or have<br />
recently left public <strong>as</strong>sistance for employment. “Working poor” adults are, in<br />
most states, left without health insurance coverage even though they have only<br />
marginally higher incomes.<br />
The correlation of hardships and health insurance status holds even when<br />
accounting for other variations among families. Table 10 shows that one of the<br />
largest predictors of a family experiencing any hardships is whether or not it<br />
h<strong>as</strong> health insurance. 10 Families with private health insurance are unlikely to
