Model Quality Report in Business Statistics - Harvard ...
Model Quality Report in Business Statistics - Harvard ...
Model Quality Report in Business Statistics - Harvard ...

Create successful ePaper yourself
Turn your PDF publications into a flip-book with our unique Google optimized e-Paper software.
This is because the weights are still constant with<strong>in</strong> strata. Us<strong>in</strong>g the same (ratio) weights <strong>in</strong><br />
SUDAAN produces a variance estimator different from the number raised one, but not very<br />
different. Averaged over 50 samples, the ratio of the variance estimates (naïve estimator to<br />
true variance estimator) is from 0.53 to 1.23, but this translates <strong>in</strong>to a ratio of cvs of only 0.88<br />
to 1.08. Nevertheless this suggests that the naïve ratio variance is too close to the expansion<br />
variance, and not appropriate to ratio estimation.<br />
Follow<strong>in</strong>g the same approach with regression estimation is not possible because it produces<br />
negative weights <strong>in</strong> some strata, and neither STATA nor SUDAAN allow negative weights.<br />
An alternative is to use the constra<strong>in</strong><strong>in</strong>g options with<strong>in</strong> GES (<strong>in</strong> this case) to produce strictly<br />
positive weights wherever a solution to the calibration equations exists, and to replace the<br />
weights (for a whole stratum) with the expansion weights where such a solution does not<br />
exist. This guarantees no negative weights, but the extent of replacement and constra<strong>in</strong><strong>in</strong>g<br />
can potentially cause a large <strong>in</strong>crease <strong>in</strong> the variance. The results are shown <strong>in</strong> Table 3.5;<br />
note, however, that the standard deviation of the po<strong>in</strong>t estimates of total seem <strong>in</strong>consistent<br />
with others presented here for the “regression” estimator. This may be due to the constra<strong>in</strong><strong>in</strong>g<br />
process (see Hedl<strong>in</strong>, Falvey, Chambers & Kokic 1998).<br />
The ma<strong>in</strong> <strong>in</strong>dication from this table seems to be that the naïve “regression” variance severely<br />
underestimates the actual variability of the estimates obta<strong>in</strong>ed with regression weight<strong>in</strong>g.<br />
None of the naïve variance estimators considered here seems to offer a good approximation<br />
to the underly<strong>in</strong>g variance of the estimates. This means that, where ratio or regression<br />
estimators are used <strong>in</strong> bus<strong>in</strong>ess surveys, appropriate software which explicitly takes account<br />
of the estimation model is necessary, and that software which uses only techniques for<br />
expansion weight<strong>in</strong>g cannot be safely used.<br />
doma<strong>in</strong><br />
Number of<br />
simulations<br />
Standard<br />
deviation of<br />
po<strong>in</strong>t estimators<br />
(% of true total)<br />
Average<br />
estimated<br />
standard error<br />
(% of true total)<br />
Bias of standard<br />
error estimate<br />
(% of sd of po<strong>in</strong>t<br />
estimators)<br />
expansion 1000 184.66 185.13 0.26<br />
“regression” 733 14.26 1.59 -88.84<br />
expansion 1000 0.08 0.13 53.97<br />
“regression” 732 6.84 0.03 -99.58<br />
expansion 1000 9.56 9.42 -1.42<br />
“regression” 732 9.67 3.12 -67.78<br />
expansion 1000 0.36 0.35 -3.04<br />
“regression” 733 23.06 0.02 -99.93<br />
total<br />
<strong>in</strong>d1<br />
<strong>in</strong>d2<br />
reg1<br />
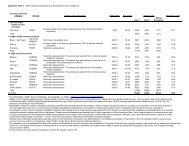
Table 3.5 Comparison of the properties of variance estimators obta<strong>in</strong>ed from STATA us<strong>in</strong>g<br />
the usual expansion weights, and us<strong>in</strong>g constra<strong>in</strong>ed or adjusted weights (see text for full<br />
description) to give a pseudo-regression estimator.<br />
3.3.3 Comparison of software package outputs<br />
Taylor variances: We will first look at the only estimation method common to all the<br />
packages, expansion estimation, and the “Taylor” (SYG) variance estimator. All the packages<br />
30