Success Factors in Nonprofit Mergers - Minnesota Council of ...
Success Factors in Nonprofit Mergers - Minnesota Council of ...
Success Factors in Nonprofit Mergers - Minnesota Council of ...

Create successful ePaper yourself
Turn your PDF publications into a flip-book with our unique Google optimized e-Paper software.
<strong>Success</strong> <strong>Factors</strong><br />
<strong>in</strong> nonpr<strong>of</strong>it mergers<br />
<strong>Factors</strong> proven to make nonpr<strong>of</strong>its mergers more likely to succeed<br />
the merger from different perspectives. The number <strong>of</strong> completed <strong>in</strong>terviews ranged<br />
from three to eight per merger. In each case, respondents <strong>in</strong>cluded at least one person<br />
represent<strong>in</strong>g the organization that was dissolved or acquired as part <strong>of</strong> the merger, the<br />
current executive director, and at least one other person, <strong>of</strong>ten a board member, who was<br />
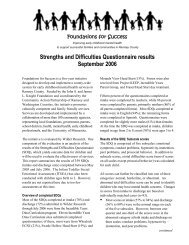
knowledgeable about the merger. Figure 1 shows the distribution <strong>of</strong> respondents <strong>in</strong> their<br />
roles at different times dur<strong>in</strong>g the merger.<br />
1. Respondents’ positions dur<strong>in</strong>g the merger<br />
Pre<br />
(N=195)<br />
Dur<strong>in</strong>g<br />
(N=187)<br />
Post<br />
(N=176)<br />
Current<br />
(N=141)<br />
Executive leadership 66 63 60 50<br />
Board <strong>of</strong> directors or governance 74 70 66 49<br />
Program adm<strong>in</strong>istration or management 18 18 17 13<br />
F<strong>in</strong>ancial adm<strong>in</strong>istration or account<strong>in</strong>g 10 11 11 7<br />
Consultant 9 10 7 6<br />
Staff 11 9 9 5<br />
Member or volunteer 5 4 3 6<br />
Market<strong>in</strong>g or communications 2 2 2 2<br />
Development 0 0 0 1<br />
Other 0 0 1 2<br />
F<strong>in</strong>ancial data collection<br />
To learn more about the f<strong>in</strong>ancial state <strong>of</strong> organizations <strong>in</strong>volved <strong>in</strong> mergers, f<strong>in</strong>ancial<br />
data were obta<strong>in</strong>ed from publicly available 990 tax forms accessed from GuideStar. When<br />
available, forms were collected for the three years prior to the merger for all organizations<br />
<strong>in</strong>volved <strong>in</strong> the merger, the first year <strong>of</strong> merged operations, and the three years follow<strong>in</strong>g<br />
the merger.<br />
Data from 349 tax forms were available, represent<strong>in</strong>g 84 <strong>of</strong> the pre-merger organizations<br />
and 38 mergers. The analysis focuses on three ratios that could be calculated for the<br />
majority <strong>of</strong> organizations for each <strong>of</strong> the three time periods identified above.<br />
Current Ratio<br />
This is a calculation <strong>of</strong> the current assets divided by current liabilities. It is an <strong>in</strong>dication<br />
<strong>of</strong> an organization’s ability to pay obligations <strong>in</strong> a timely way (with<strong>in</strong> 12 months) and is<br />
a useful <strong>in</strong>dicator <strong>of</strong> cash flow <strong>in</strong> the near future. A commonly excepted standard for<br />
reasonable performance is a ratio <strong>of</strong> 1:1, but a higher ratio is better.<br />
<strong>Success</strong> <strong>Factors</strong> In <strong>Nonpr<strong>of</strong>it</strong> <strong>Mergers</strong> 21 MAP for <strong>Nonpr<strong>of</strong>it</strong>s & Wilder Research 2012