Fast Facts 2012 - Chandler-Gilbert Community College - Maricopa ...
Fast Facts 2012 - Chandler-Gilbert Community College - Maricopa ...
Fast Facts 2012 - Chandler-Gilbert Community College - Maricopa ...

You also want an ePaper? Increase the reach of your titles
YUMPU automatically turns print PDFs into web optimized ePapers that Google loves.
The college of you.<br />
An EEO/AA institution<br />
fast facts <strong>2012</strong>
Contents<br />
ENROLLMENT<br />
<strong>College</strong> Enrollment, All Locations........................................................................ 2<br />
Williams Campus Enrollment .............................................................................. 3<br />
Dual Enrollment................................................................................................... 4<br />
STUDENT DEMOGRAPHICS<br />
Part-Time/Full-Time............................................................................................. 4<br />
Gender................................................................................................................. 5<br />
Ethnicity............................................................................................................... 5<br />
New, Former, or Continuing................................................................................. 5<br />
Age .................................................................................................................... 6<br />
International Students.......................................................................................... 7<br />
Term-to-Term Persistence.................................................................................... 7<br />
Day and Evening Attendance............................................................................... 8<br />
Student Residence........................................................................................... 8-9<br />
Class Size and Faculty/Student Ratio................................................................ 10<br />
Financial Aid...................................................................................................... 10<br />
High School........................................................................................................11<br />
STUDENT PERFORMANCE<br />
Student Engagement......................................................................................... 12<br />
Student Retention and Success in Courses....................................................... 12<br />
GRADUATES<br />
Graduates.......................................................................................................... 13<br />
TRANSFER STUDENTS<br />
Transfer Students.............................................................................................. 14<br />
EMPLOYEES<br />
Full-Time Employees by Policy Group............................................................... 15<br />
Comparison of % Employees, Students & <strong>Community</strong> by Ethnicity................... 15<br />
Adjunct Faculty Employees.............................................................................. 15<br />
FACILITIES<br />
Total Number of Buildings, Gross Square Feet, and Acres of Land................... 16<br />
Pecos Campus Builldings.................................................................................. 16<br />
Pecos Campus Land......................................................................................... 16<br />
Sun Lakes Center.............................................................................................. 16<br />
Williams Campus............................................................................................... 17<br />
ADOPTED BUDGET<br />
Annual Budgets FY <strong>2012</strong>-13 and FY 2011-12.................................................... 18<br />
General Fund, Expenditures by Function.......................................................... 18<br />
General Fund, Expenditures by Object.............................................................. 18<br />
Financial Comparisons to National Benchmarks............................................... 19<br />
COMMUNITY<br />
Population.......................................................................................................... 20<br />
East Valley Demographics................................................................................. 21<br />
Completion Agenda........................................................................................... 22<br />
<strong>Chandler</strong>-<strong>Gilbert</strong> <strong>Community</strong> <strong>College</strong> <strong>Fast</strong> <strong>Facts</strong> 2011<br />
1
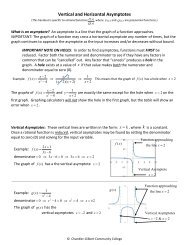
Enrollment<br />
<strong>College</strong> Enrollment<br />
All Locations<br />
FISCAL YEAR 98-99 99-00 00-01 01-02 02-03 03-04 04-05 05-06 06-07 07-08 08-09 09-10 10-11 11-12<br />
FY HEADCOUNT 7,975 9,377 10,038 10,712 12,179 12,416 12,707 13,240 14,033 15,101 15,696 16,388 17,938 19,611<br />
YEARLY CHANGE 16.1% 17.6% 7.0% 6.7% 13.7% 1.9% 2.3% 4.2% 6.0% 7.6% 3.9% 4.4% 9.5% 9.3%<br />
FY FTSE 2,172.0 2,503.0 2,927.1 3,358.2 3,848.8 4,229.9 4,431.6 4,501.0 4,802.7 5,326.1 5,677.0 6,465.0 7,206.1 7,830.0<br />
YEARLY CHANGE 13.5% 15.2% 16.9% 14.7% 14.6% 9.9% 4.8% 1.6% 6.7% 10.9% 6.6% 13.9% 11.5% 8.7%<br />
*The audit for FY FTSE 2011-12<br />
will take place in Fall <strong>2012</strong>.<br />
FALL TERMS 1998 1999 2000 2001 2002 2003 2004 2005 2006 2007 2008 2009 2010 2011<br />
FALL HEADCOUNT 4,604 5,762 6,217 6,760 7,513 8,025 8,663 8,940 9,420 10,277 10,409 11,058 12,296 14,030<br />
YEARLY CHANGE 17.7% 25.2% 7.9% 8.7% 11.1% 6.8% 8.0% 3.2% 5.4% 9.1% 1.3% 6.2% 11.2% 14.1%<br />
FALL FTSE 1,993.5 2,399.3 2,718.3 3,159.3 3,586.6 3,948.5 4,277.5 4,348.7 4,642.6 5,150.2 5,419.9 6,020.1 6,743.9 7,642.1<br />
YEARLY CHANGE 17.7% 20.4% 13.3% 16.2% 13.5% 10.1% 8.3% 1.7% 6.8% 10.9% 5.2% 11.1% 12.0% 13.3%<br />
20,000 <br />
9,000.0 <br />
Source: <strong>Maricopa</strong> Trends<br />
18,000 <br />
8,000.0 <br />
16,000 <br />
7,000.0 <br />
FTSE Definition:<br />
State law defines FTSE. 30<br />
credit hours = 1 Fiscal Year<br />
FTSE. Since a student does<br />
not take 30 credits in a single<br />
semester, Fall and Spring<br />
FTSE is reported as credit<br />
hours divided by 15. However,<br />
in the final yearly calculations,<br />
Fall and Spring FTSE is<br />
added together and divided<br />
by 2 (averaged) so it equals<br />
30 credit hours to 1 FTSE.<br />
Fiscal year FTSE includes all<br />
FTSE -- Fall, Spring, Summer,<br />
Short-Term, and Open-Entry /<br />
Open-Exit.<br />
14,000 <br />
12,000 <br />
10,000 <br />
8,000 <br />
6,000 <br />
4,000 <br />
2,000 <br />
0 <br />
98-‐99 <br />
99-‐00 <br />
00-‐01 <br />
01-‐02 <br />
02-‐03 <br />
03-‐04 <br />
04-‐05 <br />
05-‐06 <br />
06-‐07 <br />
07-‐08 <br />
08-‐09 <br />
09-‐10 <br />
10-‐11 <br />
11-‐12 <br />
6,000.0 <br />
5,000.0 <br />
4,000.0 <br />
3,000.0 <br />
2,000.0 <br />
1,000.0 <br />
0.0 <br />
98-‐99 <br />
99-‐00 <br />
00-‐01 <br />
01-‐02 <br />
02-‐03 <br />
03-‐04 <br />
04-‐05 <br />
05-‐06 <br />
06-‐07 <br />
07-‐08 <br />
08-‐09 <br />
09-‐10 <br />
10-‐11 <br />
11-‐12 <br />
FY HEADCOUNT <br />
FALL HEADCOUNT <br />
FY FTSE <br />
FALL FTSE <br />
2 <strong>Chandler</strong>-<strong>Gilbert</strong> <strong>Community</strong> <strong>College</strong> <strong>Fast</strong> <strong>Facts</strong> 2011
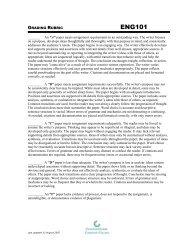
Williams Campus<br />
Enrollment<br />
FISCAL YEAR 98-99 99-00 00-01 01-02 02-03 03-04 04-05 05-06 06-07 07-08 08-09 09-10 10-11 11-12<br />
FY HEADCOUNT 1,301 1,502 1,708 2,116 2,413 2,692 2,628 2,651 2,869 3,141 3,195 3,782 3,773 3,896<br />
% CHANGE -0.1% 15.4% 13.7% 23.9% 14.0% 11.6% -2.4% 0.9% 8.2% 9.5% 1.7% 18.4% -0.2% 3.3%<br />
FY FTSE 309.3 343.3 432.8 534.0 636.5 699.4 678.4 688.2 701.4 734.7 732.6 902.7 963.0 963.4<br />
% FTSE CHANGE -13.1% 11.0% 26.1% 23.4% 19.2% 9.9% -3.0% 1.4% 1.9% 4.7% -0.3% 23.2% 6.7% 0.0%<br />
Source: <strong>Maricopa</strong> Data Warehouse<br />
4,500 <br />
4,000 <br />
3,500 <br />
3,000 <br />
2,500 <br />
2,000 <br />
1200 <br />
1000 <br />
800 <br />
600 <br />
1,500 <br />
1,000 <br />
500 <br />
400 <br />
200 <br />
0 <br />
98-‐99 <br />
99-‐00 <br />
00-‐01 <br />
01-‐02 <br />
02-‐03 <br />
03-‐04 <br />
04-‐05 <br />
05-‐06 <br />
06-‐07 <br />
07-‐08 <br />
08-‐09 <br />
09-‐10 <br />
10-‐11 <br />
11-‐12 <br />
FY HEADCOUNT <br />
FALL HEADCOUNT <br />
0 <br />
98-‐99 <br />
99-‐00 <br />
00-‐01 <br />
01-‐02 <br />
02-‐03 <br />
03-‐04 <br />
04-‐05 <br />
05-‐06 <br />
06-‐07 <br />
07-‐08 <br />
08-‐09 <br />
09-‐10 <br />
10-‐11 <br />
11-‐12 <br />
FY FTSE <br />
FALL FTSE <br />
<strong>Chandler</strong>-<strong>Gilbert</strong> <strong>Community</strong> <strong>College</strong> <strong>Fast</strong> <strong>Facts</strong> 2011<br />
3
Student Demographics<br />
Dual Enrollment<br />
Dual enrollment began in 1998. The<br />
course enrollment breakdown is<br />
mathematics -- 38%; foreign languages<br />
and sign language -- 22%; English<br />
-- 19%; and sciences -- 15%. The rest<br />
of the enrollment is in history, political<br />
science, psychology, art, business,<br />
and computers. For more information<br />
about dual enrollment see: http://www.<br />
maricopa.edu/business/ir/reports.<br />
php<br />
Source: <strong>Maricopa</strong> Data Warehouse &<br />
Official Dual Enrollment Reports<br />
FALL FALL FALL FALL FALL FALL FALL FALL FALL FALL FALL FALL FALL FALL<br />
1998 1999 2000 2001 2002 2003 2004 2005 2006 2007 2008 2009 2010 2011<br />
HEADCOUNT 345 773 644 786 797 843 1,193 1,168 1,388 1,399 1,330 1,049 1,108 2,937<br />
% COLLEGE FALL HEADCOUNT 7.5% 13.4% 10.4% 11.6% 10.6% 10.5% 13.8% 13.1% 14.7% 13.6% 12.8% 9.5% 9.0% 20.9%<br />
FALL 45TH DAY DUAL FTSE 101.1 235.9 208.1 270.9 270.8 286.6 393.7 384.5 467.2 489.3 458.5 357.8 363.9 1,224.9<br />
CHANGE FROM PREVIOUS YEAR N/A 133.0% -11.8% 30.2% < -0.1% 5.8% 37.4% -2.3% 21.5% 4.7% -6.3% -22.0% 1.7% 236.6%<br />
% COLLEGE 45TH DAY FTSE 5.1% 9.8% 7.7% 8.6% 7.6% 7.3% 9.2% 8.8% 10.1% 9.5% 8.5% 5.9% 5.4% 16.0%<br />
FALL 2001 FALL 2006 FALL 2011<br />
FULL-‐TIME 24.7% 27.5% 31.5%<br />
PART-‐TIME 75.3% 72.5% 68.5%<br />
Part-Time / Full-Time<br />
Source: <strong>Maricopa</strong> Trends<br />
NUMBER OF FALL 2001 FALL 2006 FALL 2011<br />
STUDENTS<br />
Gender<br />
FALL 2001 FALL 2006 FALL 2011<br />
MALE 44.8% 43.0% 46.8%<br />
FEMALE 50.8% 54.0% 52.1%<br />
Source: <strong>Maricopa</strong> Trends<br />
UNDECLARED 3.6% 3.1% 1.0%<br />
Ethnicity<br />
Source: <strong>Maricopa</strong> Trends<br />
FALL 2001 FALL 2006 FALL 2011<br />
American Indian 1.8% 1.9% 1.7%<br />
Asian 3.8% 5.4% 6.2%<br />
Black 2.1% 3.6% 4.9%<br />
Hispanic 13.9% 14.9% 17.5%<br />
White 70.5% 66.1% 58.4%<br />
Other 7.9% 8.1% 11.2%<br />
20.0% <br />
18.0% <br />
16.0% <br />
14.0% <br />
12.0% <br />
10.0% <br />
8.0% <br />
6.0% <br />
4.0% <br />
2.0% <br />
1.8% <br />
1.9% <br />
1.7% <br />
5.4% <br />
3.8% <br />
6.2% <br />
4.9% <br />
3.6% <br />
2.1% <br />
17.5% <br />
14.9% <br />
13.9% <br />
0.0% <br />
American Indian Asian Black Hispanic <br />
New, Former, or<br />
Continuing<br />
FALL 2001 FALL 2006 FALL 2011<br />
NEW 47.4% 48.1% 48.4%<br />
FALL 2001 FALL 2006 FALL 2011 <br />
FORMER 12.9% 13.4% 12.5%<br />
CONTINUING 39.7% 38.5% 39.1%<br />
Definitions<br />
The Student Information System generates this code.<br />
Source: <strong>Maricopa</strong> Trends<br />
New Students: Student attended CGCC for the first time in the fall or the previous summer.<br />
Former Students: Student attended CGCC the previous fall term or any term before that.<br />
Continuing Students: Student attended CGCC the previous spring term.<br />
<strong>Chandler</strong>-<strong>Gilbert</strong> <strong>Community</strong> <strong>College</strong> <strong>Fast</strong> <strong>Facts</strong> 2011<br />
5
Student Demographics<br />
Age<br />
FALL 2001 FALL 2006 FALL 2011<br />
15-19 38.4% 44.3% 50.4%<br />
20-24 24.3% 26.0% 24.2%<br />
25-29 9.5% 9.5% 8.9%<br />
30-39 13.7% 10.3% 9.2%<br />
40-49 8.3% 6.1% 4.8%<br />
50-59 3.2% 2.3% 1.9%<br />
60+ 1.3% 0.7% 0.6%<br />
UNDEC 1.4% 0.7% 0.0%<br />
Source: <strong>Maricopa</strong> Trends<br />
60.0% <br />
50.0% <br />
40.0% <br />
30.0% <br />
20.0% <br />
10.0% <br />
0.0% <br />
50.4% <br />
44.3% <br />
38.4% <br />
26.0% <br />
24.3% 24.2% <br />
13.7% <br />
9.5% <br />
9.5% <br />
8.9% 10.3% <br />
9.2% 8.3% <br />
6.1% 4.8% <br />
3.2% 2.3% 1.9% 1.3% 0.7% 0.6% <br />
15-‐19 20-‐24 25-‐29 30-‐39 40-‐49 50-‐59 60+ <br />
FALL 2001 FALL 2006 FALL 2011 <br />
Source: National <strong>Community</strong> <strong>College</strong><br />
Benchmark Project (NCCBP), 2011<br />
Median Age: 20 National Percentile: 13%<br />
Students at 87% of community colleges are older.<br />
6 <strong>Chandler</strong>-<strong>Gilbert</strong> <strong>Community</strong> <strong>College</strong> <strong>Fast</strong> <strong>Facts</strong> 2011
International Students<br />
FALL 45TH DAY<br />
2002 2003 2004 2005 2006 2007 2008 2009 2010 2011<br />
Note: Other Visas include<br />
diplomatic, exchange<br />
visitor, temporary visitors<br />
for business, pleasure<br />
or special occupation;<br />
employment authorization;<br />
finance, treaty, or<br />
investment traders; and the<br />
dependents for any<br />
of the foregoing.<br />
F-1 Student Visa 18 13 14 30 36 45 55 43 51 36<br />
F-2 Student Spouse Visa 2 3 4 4 0 4 1 2 1 0<br />
Other Visas 20 21 17 23 44 62 50 54 63 40<br />
Subtotal 40 37 35 57 80 111 106 99 115 76<br />
% Students with Visas 0.5% 0.5% 0.4% 0.6% 0.8% 1.1% 1.0% 0.9% 0.9% 0.5%<br />
Permanent Resident 306 342 365 395 430 447 430 484 510 527<br />
Refugee 6 7 5 5 8 9 8 7 10 9<br />
Subtotal 312 349 370 400 438 456 438 491 520 536<br />
% Immigrant & Refugee 4.2% 4.3% 4.3% 4.5% 4.6% 4.4% 4.2% 4.4% 4.2% 3.8%<br />
All International Students 352 386 405 457 518 567 544 590 635 612<br />
% International Students 4.7% 4.8% 4.7% 5.1% 5.5% 5.5% 5.2% 5.3% 5.2% 4.4%<br />
Source: <strong>Maricopa</strong> Warehouse<br />
Term-to-Term<br />
Persistence<br />
Source: National <strong>Community</strong> <strong>College</strong><br />
Benchmark Project (NCCBP), 2011<br />
Fall to Spring: 65.5% National Percentile: 22%<br />
This is the percent of students who were enrolled in the fall who re-enrolled in the spring term. The national percentile indicates that<br />
78% of community colleges have a higher fall to spring persistence rate.<br />
Fall to Fall: 44.0% National Percentile: 18%<br />
This is the percent of students who enrolled in fall and who returned the next fall term. The national percentile indicates that 82% of<br />
community colleges have a higher fall to fall persistence rate.<br />
<strong>Chandler</strong>-<strong>Gilbert</strong> <strong>Community</strong> <strong>College</strong> <strong>Fast</strong> <strong>Facts</strong> 2011<br />
7
Student Demographics<br />
Primary Time of<br />
Attendance<br />
In Fall 2008, the Day/Evening<br />
breakout was changed to Primary<br />
Time of Attendance.This reflects<br />
when students take most of their<br />
classes. The addition of weekend<br />
and non-traditional categories better<br />
reflects current attendance patterns.<br />
FALL FALL FALL FALL FALL FALL<br />
2001 2006 2008 2009 2010 2011<br />
DAY 62.7% 71.8% 58.3% 61.1% 63.5% 55.2%<br />
EVENING 37.3% 28.2% 20.3% 20.0% 17.5% 15.3%<br />
WEEKEND N/A N/A 3.0% 3.5% 3.2% 2.4%<br />
NON-TRADITIONAL N/A N/A 18.1% 15.3% 15.8% 27.0%<br />
UNKNOWN N/A N/A 0.2% 0.2% 0.1% 0.1%<br />
Evening begins at 4:30 p.m.<br />
Source: <strong>Maricopa</strong> Trends<br />
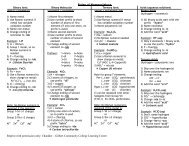
Student Residence<br />
Between Fall 2001 and Fall 2011, 92% to 95% of CGCC students came from an expanded East Valley. The percent of students<br />
coming from CGCC’s Core Area — <strong>Chandler</strong>, <strong>Gilbert</strong>, Queen Creek, and the Mesa ZIP codes along and south of US 60 —<br />
increased from 72% to 86%.<br />
8 <strong>Chandler</strong>-<strong>Gilbert</strong> <strong>Community</strong> <strong>College</strong> <strong>Fast</strong> <strong>Facts</strong> 2011
Student Residence<br />
Students by East Valley, CGCC<br />
Core Area & City<br />
Note: In rapidly growing areas zip<br />
codes change frequently. The data<br />
were pulled using city name.<br />
To obtain population<br />
figures for Ahwatukee and Mesa along<br />
and south of US 60, ZIP codes<br />
were used.<br />
Wickenberg<br />
Surprise<br />
Un inc Area<br />
Source: <strong>Maricopa</strong> Data Warehouse<br />
FALL 45TH DAY<br />
EAST VALLEY BY CITY 2001 2002 2003 2004 2005 2006 2007 2008 2009 2010 2011<br />
AHWATUKEE 138 132 143 157 185 250 326 374 478 525 510<br />
APACHE JUNCTION 86 59 73 70 68 61 77 48 49 34 46<br />
CHANDLER 2,223 2,460 2,496 2,830 2,890 3,031 3,183 3,150 3,272 3,522 4,238<br />
GILBERT 2,183 2,547 2,744 3,012 3,001 3,153 3,524 3,786 3,977 4,420 5,183<br />
MESA §¨¦ I-17<br />
1,241 1,316 1,386 1,344 1,257 1,233 1,283 1,200 1,340 1,577 1,679<br />
QUEEN CREEK 261 256<br />
Cave Creek<br />
335 423 656 767 915 1,044 1,062 1,215 1,379<br />
TEMPE 195 223 214 194 163 174Headcount<br />
191 221 245 274 269<br />
Un !<br />
TOTAL 6,327 6,993 7,391 8,030 8,220 8,669 inc 9,499 Area Student 9,823 10,423 11,567 13,304<br />
% OF ALL STUDENTS 93.6% 93.1% 92.1% 92.7% 91.9% 92.0% 92.4% 94.4% 94.3% 94.1% 94.8%<br />
Peoria<br />
CORE AREA<br />
CHANDLER, GILBERT,<br />
FALL 45TH DAY<br />
QUEEN CREEK, & MESA 2001 2002 2003 2004 2005 2006 2007 2008 2009 2010<br />
NEAR & SOUTH OF US60 4,896 5,577 5,929 6,631 6,909 7,375 8,015 8,835 9,327 10,378<br />
Scottsdale<br />
% OF ALL STUDENTS 72.4% PVCC 74.2% 73.9% 76.5% 77.3% 78.3% 78.0% 84.9% 84.3% 84.4%<br />
ALL 45TH DAY STUDENTS 6,760 7,513<br />
vw101<br />
8,025 8,663 8,940 9,420 10,277 10,409 11,058 12,296<br />
vw101<br />
El Mirage<br />
GCC<br />
Phoenix<br />
Fountain Hills<br />
Fort Mc Dowell<br />
Buckeye<br />
Fall 2011 CGCC Students<br />
The chart displays data for each city,<br />
CGCC’s Core Area, and the East Valley<br />
including Ahwatukee and Apache<br />
Junction.The dot density map plots<br />
student residence.<br />
±<br />
0 5<br />
1:450,000<br />
1 inch = 7 miles<br />
2.5 Miles<br />
Goodyear<br />
Source: MCCCD Institutional Research Information System(IRIS)<br />
Prepared by: MCCCD Office of Institutional Effectiveness<br />
Date: 1/27/<strong>2012</strong><br />
EMCC<br />
Glendale<br />
vw101<br />
Avondale<br />
PC<br />
rx51<br />
§¨¦<br />
GWCC<br />
I-10<br />
RSCTempe<br />
SMCC<br />
vw 202<br />
Gila River Indian <strong>Community</strong><br />
§¨¦ I-10<br />
SCC<br />
MCC<br />
<strong>Chandler</strong><br />
CGCC<br />
vw 202<br />
Mesa<br />
<strong>Gilbert</strong><br />
Queen Creek<br />
Source: <strong>Maricopa</strong> Trends<br />
<strong>Chandler</strong>-<strong>Gilbert</strong> <strong>Community</strong> <strong>College</strong> <strong>Fast</strong> <strong>Facts</strong> 2011<br />
9
Student Demographics<br />
Class Size and<br />
Faculty/ Student Ratio<br />
Source: National <strong>Community</strong> <strong>College</strong><br />
Benchmark Project (NCCBP), 2011<br />
Average Class Size: 23.6 National Percentile: 86%<br />
The national percentile indicates that 85% of community colleges have smaller classes.<br />
Faculty Student Ratio: 22.2 National Percentile: 69%<br />
The national percentile indicates that 68% of community colleges have more faculty to students.<br />
Financial Aid<br />
Number of Students Receiving Financial Aid Fall 2010 Fall 2011<br />
Number of Students Receiving Financial Aid: 4,539 5,000<br />
Percent of Total Student Body: 37% 45%<br />
Number of Full-Time Students Receiving Financial Aid: 2,409 2,546<br />
Percent of All Full-Time Students: 56% 61%<br />
Number of Part-Time Students Receiving Financial Aid: 2,130 2,454<br />
Percent of All Part-Time Students: 27% 35%<br />
FY 2010-11 FY 2011-12<br />
Total Financial Aid Funds Paid to Students $24,723,792.86 $27,810,164.37<br />
Financial Aid is awarded on an annual basis. It includes all financial aid, scholarships and loans awarded through the<br />
CGCC Financial Aid Office. Some students may have received additional scholarships or loans from other sources.<br />
Percent of students receiving financial aid includes Title IV eligible students; it excludes students still in high school.<br />
Students Receiving Financial Aid<br />
By Ethnicity and Gender, Fall 2011<br />
Source: <strong>Maricopa</strong> Data Warehouse &<br />
Financial Aid Records<br />
NUMBER OF STUDENTS<br />
FEMALE MALE UNKNOWN TOTAL<br />
AMERICAN INDIAN 85 61 2 148<br />
ASIAN 128 106 2 236<br />
BLACK 204 201 5 410<br />
HISPANIC 628 415 4 1,047<br />
WHITE 1,528 1,202 18 2,748<br />
OTHER 20 12 0 32<br />
UNKNOWN 173 203 3 379<br />
TOTAL 2,766 2,200 34 5,000<br />
PERCENTAGES<br />
FEMALE MALE UNKNOWN TOTAL<br />
3.1% 2.8% 5.9% 3.0%<br />
4.6% 4.8% 5.9% 4.7%<br />
7.4% 9.1% 14.7% 8.2%<br />
22.7% 18.9% 11.8% 20.9%<br />
55.2% 54.6% 52.9% 55.0%<br />
0.7% 0.5% 0.0% 0.6%<br />
6.3% 9.2% 8.8% 7.6%<br />
100.0% 100.0% 100.0% 100.0%<br />
55.3% 44.0% 0.7% 100.0%<br />
10 <strong>Chandler</strong>-<strong>Gilbert</strong> <strong>Community</strong> <strong>College</strong> <strong>Fast</strong> <strong>Facts</strong> 2011
High School<br />
Students who graduated from high<br />
school in 2011 and attended CGCC in<br />
Fall 2011.<br />
NUMBER %<br />
EAST VALLEY 1,700 87.1%<br />
ALL OTHER AZ HS 111 5.7%<br />
OUT-‐OF-‐STATE & US POS 66 3.4%<br />
FOREIGN 8 0.4%<br />
UNKNOWN/OTHER 66 3.4%<br />
TOTAL 1,951 100.0%<br />
Source: <strong>Maricopa</strong> Data Warehouse<br />
CHANDLER<br />
BASHA 170<br />
CHANDLER 109<br />
HAMILTON 146<br />
PERRY 131<br />
SUBTOTAL 556<br />
GILBERT<br />
DESERT RIDGE 80<br />
GILBERT 162<br />
HIGHLAND 125<br />
MESQUITE 166<br />
SUBTOTAL 533<br />
HIGLEY<br />
HIGLEY 65<br />
WILLIAMS FIELD 76<br />
SUBTOTAL 141<br />
QUEEN CREEK<br />
QUEEN CREEK 94<br />
SUBTOTAL 94<br />
2011 EAST VALLEY HIGH SCHOOL GRADUATES<br />
AT CGCC FALL 2011 BY SCHOOL DISTRICT <br />
MESA<br />
DOBSON 27<br />
MESA 21<br />
MOUNTAIN VIEW 10<br />
RED MOUNTAIN 13<br />
SKYLINE 13<br />
WESTWOOD 4<br />
SUBTOTAL 88<br />
TEMPE<br />
COMPADRE 2<br />
CORONA DEL SOL 56<br />
DESERT VISTA 73<br />
MARCOS DE NIZA 7<br />
MCCLINTOCK 3<br />
MOUNTAIN POINT 43<br />
SUBTOTAL 184<br />
CHARTERS & PRIVATE 101<br />
APACHE JUNCTION 3<br />
<strong>Chandler</strong>-<strong>Gilbert</strong> <strong>Community</strong> <strong>College</strong> <strong>Fast</strong> <strong>Facts</strong> 2011<br />
11
student Performance<br />
Student Engagement<br />
<strong>Community</strong> <strong>College</strong> Survey of<br />
Student Engagement, 2011<br />
The next administration of CCSSE will<br />
be Spring 2014.<br />
What do these numbers mean<br />
Each of the benchmarks is described below. How are the<br />
benchmarks created For each benchmark there are a set of<br />
related questions. For example, Student Effort questions ask<br />
students if they prepared two or more drafts of a paper, came<br />
to class unprepared, how much they read both for classes and<br />
for personal enrichment, etc. The responses are combined to<br />
create a score for each college. From the raw scores, percentiles<br />
are computed so colleges can compare themselves to other<br />
community colleges. To allow community colleges to compare<br />
ALL LARGE URBAN<br />
CGCC COMPARED TO<br />
COLLEGES COLLEGES COLLEGES<br />
ACTIVE & COLLABORATIVE LEARNING 80-‐90% 90-‐99% 80-‐90%<br />
STUDENT EFFORT 20-‐30% 30-‐40% 20-‐30%<br />
ACADEMIC CHALLENGE 30-‐40% 30-‐40% 20-‐30%<br />
STUDENT FACULTY INTERACTION 50-‐60% 60-‐70% 60-‐70%<br />
SUPPORT FOR LEARNERS 50-‐60% 60-‐70% 50-‐60%<br />
themselves to like institutions, percentiles are further broken down by ALL COLLEGES — all CCSSE participants, LARGE COLLEGES — colleges with a fall<br />
headcount enrollment of 7,500 or more, and URBAN COLLEGES — colleges in large metropolitan areas.<br />
For example, Active and Collaborative Learning assesses how actively students are involved in their education; their opportunities to think and apply what they<br />
learn in different settings; and if they collaborate with others to solve problems or master challenging content. CGCC excels in this area. Compared to all CCSSE<br />
colleges. CGCC is between the 80th to 90th percentiles, which means that 79% of other community colleges rank lower on this measure. CGCC ranks between<br />
the 90th to 99th percentile compared to other large colleges, and between the 80th to 90th percentile compared to other urban colleges.<br />
Student Effort:<br />
Assesses the extent to which students apply themselves and engage in activities important to their academic success.<br />
Academic Challenge:<br />
Assesses the nature and amount of assigned academic work; the complexity of cognitive tasks; and the standards faculty use to evaluate students.<br />
Source: <strong>Community</strong> <strong>College</strong> Survey of<br />
Student Engagement (CCSSE), 2011<br />
Student Success<br />
in Courses<br />
Source: National <strong>Community</strong> <strong>College</strong><br />
Benchmark Project (NCCBP), 2011<br />
Faculty-Student Interaction:<br />
Assesses the extent of faculty-student interaction both in and out of the classroom.<br />
Support for Learners:<br />
Assesses the extent of student use of key academic and student support services such as advising, career planning, tutoring center, and financial aid.<br />
Success Rate: 77.1% National Percentile: 63%<br />
The success rate is the number of students who received a grade of A, B, C, or P divided by all students who enrolled in courses numbered 100<br />
and above. This means that nearly 77% of the students received an A, B, C or P and roughly 23% received grades of D, F, W or withdrawal failing.<br />
The national percentile indicates that 62% of community colleges have fewer students who succeed in courses — receive grades of A, B, C, or P<br />
and more who fail, withdraw or get a D.<br />
12 <strong>Chandler</strong>-<strong>Gilbert</strong> <strong>Community</strong> <strong>College</strong> <strong>Fast</strong> <strong>Facts</strong> 2011
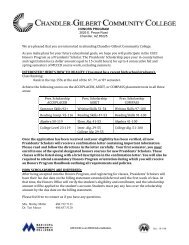
Graduates<br />
Graduates<br />
Number of Degrees and<br />
Certificates Granted<br />
There are two sets of data here. The<br />
first is the number of degrees and<br />
certificates CGCC reports to IPEDS<br />
- a required report to the federal<br />
government. However, many students<br />
receive more than one award — in the<br />
last year several students received<br />
as many as four degrees and/or<br />
certificates. The second chart shows<br />
how many people actually received<br />
a degree or certificate. If a student<br />
received both a degree and a certificate<br />
they are counted only one time in the<br />
degree column. The most common<br />
combination of multiple awards is an<br />
associates degree and the AGEC - the<br />
Arizona General Education Certificate.<br />
This allows students to transfer their<br />
general education credits to Arizona<br />
universities as a block.<br />
The first year IPEDS reported AGEC<br />
awards was 2006-07.<br />
Sources: IPEDS for Number of Degrees &<br />
Certificates; <strong>Maricopa</strong> Data Warehouse for<br />
Number of People Receiving Degrees &<br />
Certificates<br />
Sources: IPEDs & National <strong>Community</strong><br />
<strong>College</strong> Benchmark Project (NCCBP), 2011<br />
Number of Degrees and Certificates Granted<br />
2001-02 2002-03 2003-04 2004-05 2005-06 2006-07 2007-08 2008-09 2009-10 2010-11<br />
DEGREES 257 329 286 368 342 395 416 514 545 747<br />
CERTIFICATES 190 224 175 139 152 189 216 170 167 168<br />
AGECS 9 17 30 45 105 375 219 409 473 607<br />
TOTAL AWARDS 456 570 491 552 599 959 851 1,093 1,185 1,522<br />
Number of People Receiving Degrees and Certificates<br />
1,600 <br />
1,400 <br />
1,200 <br />
1,000 <br />
800 <br />
600 <br />
400 <br />
200 <br />
0 <br />
2001-‐02 <br />
2002-‐03 <br />
DEGREES <br />
AGECS <br />
2001-02 2002-03 2003-04 2004-05 2005-06 2006-07 2007-08 2008-09 2009-10 2010-11<br />
DEGREES 221 298 270 345 303 368 388 499 528 730<br />
CERTIFICATES 92 118 108 92 100 338 162 132 145 159<br />
TOTAL PEOPLE 313 416 378 437 403 706 550 631 673 889<br />
Number of Degrees & Certificates Awarded<br />
2003-‐04 <br />
2004-‐05 <br />
2005-‐06 <br />
2006-‐07 <br />
2007-‐08 <br />
2008-‐09 <br />
CERTIFICATES <br />
TOTAL AWARDS <br />
2009-‐10 <br />
2010-‐11 <br />
Number of People Receiving Degrees & Certificates<br />
Percent of First-Time Degree Seeking Students Who Receive a Degree Within Three Years:<br />
1,000 <br />
900 <br />
800 <br />
700 <br />
600 <br />
500 <br />
400 <br />
300 <br />
200 <br />
100 <br />
0 <br />
2001-‐02 <br />
2002-‐03 <br />
2003-‐04 <br />
2004-‐05 <br />
2005-‐06 <br />
2006-‐07 <br />
2007-‐08 <br />
2008-‐09 <br />
2009-‐10 <br />
2010-‐11 <br />
DEGREES CERTIFICATES TOTAL PEOPLE <br />
CGCC Percentage: 12.7% National Percentile: 23%<br />
This means that 77% of community colleges have a higher percentage of students graduating in three years.<br />
This is based on the IPEDS Student-Right-to-Know Cohort.<br />
<strong>Chandler</strong>-<strong>Gilbert</strong> <strong>Community</strong> <strong>College</strong> <strong>Fast</strong> <strong>Facts</strong> 2011<br />
13
Transfer Students<br />
Transfer Students<br />
Number of CGCC Transfers to<br />
ASU, NAU, & U of A by Year:<br />
TOTAL NEW<br />
ATTENDING TRANSFERS<br />
FALL 2001 1,069 202<br />
FALL 2002 1,273 207<br />
FALL 2003 1,529 309<br />
FALL 2004 1,837 361<br />
3,500 <br />
3,000 <br />
2,500 <br />
2,000 <br />
Source: ASSIST<br />
Note: In prior years <strong>Fast</strong> <strong>Facts</strong> used the<br />
Decision Support System of obtain this<br />
data. DSS is not currently updated. The<br />
numbers above include only those students<br />
who transferred 12 or more hours to the<br />
universities. They may differ from<br />
earlier reports.<br />
FALL 2005 1,997 368<br />
FALL 2006 2,179 386<br />
FALL 2007 2,354 449<br />
FALL 2008 2,537 489<br />
FALL 2009 2,727 628<br />
FALL 2010 2,991 686<br />
FALL 2011 3,060 723<br />
1,500 <br />
1,000 <br />
500 <br />
0 <br />
F'01 <br />
F'02 <br />
F'03 <br />
F'04 <br />
F'05 <br />
F'06 <br />
F'07 <br />
F'08 <br />
F'09 <br />
F'10 <br />
F'11 <br />
TOTAL NEW <br />
Compare Number of CGCC<br />
Students Receiving a Degree or<br />
Certificate to Number of CGCC<br />
Transfers Receiving a Degree<br />
from ASU, NAU or U of A<br />
UNIVERSITY CGCC<br />
2001-02 605 313<br />
2002-03 715 416<br />
2003-04 880 376<br />
2004-05 1,067 437<br />
2005-06 1,235 403<br />
2,500 <br />
2,000 <br />
1,500 <br />
1,000 <br />
Sources: CGCC Graduates -- See Page 13<br />
University Graduates -- ASSIST<br />
This chart presents the number of people<br />
who received degrees; at both the<br />
universitites and CGCC. Many students<br />
received multiple degrees<br />
and/or certificates.<br />
2006-07 1,346 706<br />
2007-08 1,456 550<br />
2008-09 1,585 631<br />
2009-10 1,660 673<br />
2010-11 1,934 889<br />
500 <br />
0 <br />
2001-‐02 <br />
2002-‐03 <br />
2003-‐04 <br />
2004-‐05 <br />
UNIVERSITY <br />
2005-‐06 <br />
2006-‐07 <br />
2007-‐08 <br />
2008-‐09 <br />
CGCC <br />
2009-‐10 <br />
2010-‐11 <br />
Performance After Transfer<br />
Source: National <strong>Community</strong> <strong>College</strong><br />
Benchmark Project (NCCBP), 2011<br />
GPA--First Year After Transfer: 3.00 National Percentile: 81%<br />
Average Number Of<br />
Credits Completed: 20.4 National Percentile: 59%<br />
Percent Enrolled in University<br />
For The Second Year: 87.7% National Percentile: 91%<br />
Note: 80% of community colleges<br />
report transfer GPA’s of less than 3.0;<br />
90% report a lower university second<br />
year enrollment rate; and at 58% of<br />
community college’s students complete<br />
fewer university credit hours.<br />
14 <strong>Chandler</strong>-<strong>Gilbert</strong> <strong>Community</strong> <strong>College</strong> <strong>Fast</strong> <strong>Facts</strong> 2011
Employees<br />
Full-Time Employees<br />
by Policy Group<br />
NUMBER %<br />
FACULTY<br />
134 42.3%<br />
EXECUTIVE ADMINISTRATIVE MANAGERIAL 31 9.8%<br />
TECHNICAL & PARAPROFESSIONAL <br />
OTHER PROFESSIONALS<br />
CLERICAL & SECRETARIAL<br />
SKILLED CRAFTS<br />
SERVICE MANTENANCE<br />
TOTAL<br />
35 11.0%<br />
22 6.9%<br />
70 22.1%<br />
3 0.9%<br />
22 6.9%<br />
317 100.0%<br />
Comparison of %<br />
Employees, Students,<br />
& <strong>Community</strong> By<br />
Ethnicity, Fall 2011<br />
AMERICAN INDIAN<br />
ASIAN<br />
BLACK<br />
HISPANIC<br />
WHITE<br />
OTHER<br />
EMPLOYEES STUDENTS COMMUNITY<br />
0.6%<br />
3.2%<br />
6.9%<br />
18.9%<br />
68.5%<br />
1.9%<br />
1.7%<br />
6.2%<br />
4.9%<br />
17.5%<br />
58.4%<br />
11.2%<br />
0.9%<br />
6.9%<br />
3.8%<br />
18.6%<br />
67.3%<br />
2.5%<br />
Adjunct Faculty<br />
Employees<br />
Sources: Employee Data: IPEDS Fall Staff,<br />
2011<br />
Student Data: <strong>Maricopa</strong> Trends<br />
<strong>Community</strong> Trends: US Census 2010 for<br />
<strong>Chandler</strong>, <strong>Gilbert</strong>, & Queen Creek Combined<br />
Fall 2011 492<br />
Source: National <strong>Community</strong> <strong>College</strong><br />
Benchmark Project (NCCBP), 2011<br />
National Percentile — % of Minority Employees 86%<br />
This means that 85% of community colleges have a smaller percentage of minority enmployees.<br />
<strong>Chandler</strong>-<strong>Gilbert</strong> <strong>Community</strong> <strong>College</strong> <strong>Fast</strong> <strong>Facts</strong> 2011<br />
15
FACILITIES<br />
Total Number of<br />
Buildings, Gross<br />
Square Feet, and<br />
Acres of Land<br />
Pecos Campus<br />
Buildings<br />
GSF: Gross Square Feet<br />
Source: CGCC Facilities Services<br />
NUMBER<br />
buildings<br />
Size<br />
(gsf)<br />
TOTAL<br />
ACRES<br />
PECOS CAMPUS 17 340,914 127.00<br />
WILLIAMS CAMPUS 9 224,992<br />
55.74<br />
SUN LAKES CENTER 1 11,068 0.25<br />
TOTAL 27 576,974 182.99<br />
Pecos Campus buildings Size (gsf)<br />
Year<br />
Const.<br />
Year<br />
Remodeled<br />
AGA - Agave Hall 29,310 1-1-1986 2000<br />
BRD - Bradshaw Hall 33,934 1-1-1986 2000<br />
BA - Bradshaw ANNEX 1,440 1-1-2000<br />
PSB - Public Safety Building 4,874 1-1-1986<br />
LIB - Library 60,670 1-1-1998<br />
CHO - Cholla Hall 41,707 1-1-1998<br />
SAG - Saguaro Hall 20,510 1-1-1998<br />
EST - Estrella Hall 17,012 1-1-1998<br />
FSB - Facilities Services building 5,113 1-1-1998<br />
PAC - Arnette Scott Ward<br />
Performing Arts Center<br />
31,652 6-2-2002<br />
SC - Student Center 20,510 1-2-2003<br />
BKS - Bookstore 2,400 1-1-2003<br />
ATB - ATHLETIC TRAINING BUILDING 1,668 7-1-2004<br />
GIL - Gila hall 3,581 8-1-2006<br />
ACR - ATHLETIC CONCESSION/<br />
790 8-1-2007<br />
restrooms<br />
JAC - JACARANDA HALL 3,990 8-1-2008<br />
JAV - javElina hall 3,991 9-1-2009<br />
IRN - IRONWOOD HALL 57,446 11-1-2009<br />
ETC - RAMADA 1,755 8-30-<strong>2012</strong><br />
total 340,914<br />
Pecos Campus Land<br />
Pecos campus<br />
acreage<br />
Acres<br />
Year<br />
purchased<br />
Original parcel 79.32 1981<br />
Athletics parcel 37.11 1995<br />
GILBERT ROAD ENTRANCE 2.89 2003<br />
City right of ways -1.4 2006<br />
CORNER LAND (PECOS<br />
10 2009<br />
GILBERT ROADS)<br />
total 127,000<br />
Sun Lakes Center<br />
Sun Lakes Center<br />
Building Size (gsf) Year Const.<br />
First Floor 5,000 Fall 1997<br />
Second Floor & Main<br />
6,068 Sept. 2006<br />
Entry/Lobby<br />
TOTAL 11,068<br />
16 <strong>Chandler</strong>-<strong>Gilbert</strong> <strong>Community</strong> <strong>College</strong> <strong>Fast</strong> <strong>Facts</strong> 2011
Williams Campus<br />
Buildings<br />
Williams campus - non-residential<br />
Building<br />
Mesa addresses<br />
Size<br />
(gsf)<br />
Year<br />
Const.<br />
year<br />
remodeled<br />
THOM - Thomas Hall 7051 E. Texas 10,930 1958 1996<br />
PEC - physical education center 7460 E. Texas 23,118 1968 1994<br />
MSB - Mortuary Science building 7440 E. Tahoe 6,383 1979 2000<br />
BLUF - Bluford hall 7360 E. Tahoe 92,866 1984 2000<br />
eutc - Electric utility technology classroom 7360 E. Tahoe 1,848 2006<br />
facb - facilities building 7360 E. Tahoe 3,024 1984 2009<br />
HNGR - HANGAR 5733 S. Sossaman 21,892 2008<br />
EGEL - ENGEL HALL 7418 E. Tahoe 28,659 2008<br />
BAYL - baylor hall complex 7465 & 7459 E. Tillman 18,377 1973 & 1985 2009<br />
BRID - BRIDGET HALL 7412 E. TAHOE 17,895 1-1-2011<br />
TOTAL 224,992<br />
Williams Campus - Residential<br />
Residence Halls Size (GSF) Year Const.<br />
5830 S. Twinning (Bldg 324 / 40 bedrooms) 18,897 1968<br />
5815 S. Sterling (Bldg 326 / 40 bedrooms) 18,897 1968<br />
5829 S. Twinning (Bldg 334 / 40 bedrooms) 18,107 1972<br />
7303 E. Tahoe (Bldg 344 / 40 bedrooms) 18,107 1972<br />
5816 S. Avery (Bldg 354 / 40 bedrooms) 18,107 1972<br />
total = 200 bedrooms 92,115<br />
Homes<br />
7150-7263 E. Trent or E. Thistle<br />
5706-5762 S. Raven, S. Amulet or S. Rowen original construction in 1956<br />
(original unit numbers 9001-9045)<br />
remodeled in 1970s<br />
22 two bedroom, two bath homes 24,640 1975<br />
20 three bedroom, two bath homes 27,200 1975<br />
Source: CGCC Facilities Services<br />
3 five bedroom, two bath homes 4,971 1975<br />
total = 119 bedrooms 56,811<br />
NOTE: All housing is under a 30-year ground lease beginning 3 /2001 and is managed and operated by a third party.<br />
<strong>Chandler</strong>-<strong>Gilbert</strong> <strong>Community</strong> <strong>College</strong> <strong>Fast</strong> <strong>Facts</strong> 2011<br />
17
ADOPTED Budget<br />
Annual Budgets<br />
FY <strong>2012</strong>-13 and<br />
FY 2011-12<br />
General Fund<br />
Expenditures by Function<br />
General Fund<br />
Expenditures by Object<br />
Source: CGCC Adopted Budget<br />
FY 2011-12 & FY <strong>2012</strong>-13<br />
Annual Budget Summary<br />
Annual Budgets FY <strong>2012</strong>-13 FY 2011-12<br />
General Fund Budgeted Expenditures by Function<br />
FY <strong>2012</strong>-13 FY 2011-12<br />
Annual Change<br />
Amount<br />
Annual Change<br />
Variance<br />
Percent<br />
General Fund $46,456,181 $45,987,527 $468,654 1.0%<br />
Auxiliary Fund $3,998,452 $4,115,773 ($117,321) -2.9%<br />
Restricted Fund $15,268,179 $11,038,642 $4,229,537 38.3%<br />
Plant Fund $752,000 $752,000 $0.00 0.0%<br />
Total Budget $66,474,812 $61,893,942 $4,580,870 7.4%<br />
Percent<br />
Instruction $23,235,656 $22,956,686 $278,970 1.2%<br />
Academic Support $5,802,740 $5,484,269 $381,471 5.8%<br />
Administration $2,454,986 $2,285,567 $169,419 7.4%<br />
Student Services $4,670,363 $4,422,741 $247,622 5.6%<br />
Physical Plant $5,731,366 $4,332,012 $1,399,354) 32.3%<br />
General Institutional $3,810,064 $5,764,463 ($1,954,399) -33.9%<br />
Public Service $179,874 $175,357 $4,517 2.6%<br />
SCHOLARSHIP $571,132 $566,432 $4,700 0.8%<br />
Total Budget $46,456,181 $45,987,527 $468,654 1.0 %<br />
General Fund Budgeted Expenditures by Object<br />
FY<strong>2012</strong>-13<br />
FY2011-12<br />
Annual Change<br />
VARIANCE<br />
Percent<br />
Salaries & Wages $30,017,837 $29,127,190 $890,647 3.1%<br />
Employee Benefits $8,422,536 $7,827,203 $595,333 7.6%<br />
Contractual Services $2,14,199 $1,590,351 $551,848 34.7%<br />
Supplies & Materials $1,095,789 $968,531 $127,258 13.1%<br />
Fixed Charges $402,303 $463,143 ($60,840) -13.1%<br />
Communication & Utilities $1,596,724 $1,563,674 $33,050 2.1%<br />
Travel $101,296 $97,746 $3,550 3.6%<br />
Misc & Transfers $2,677,497 $4,349,689 ($1,672,197) -38.4%<br />
Total Budget $46,456,181 $45,987,527 $468,654 1.0%<br />
18 <strong>Chandler</strong>-<strong>Gilbert</strong> <strong>Community</strong> <strong>College</strong> <strong>Fast</strong> <strong>Facts</strong> 2011
Financial Comparisons<br />
to National Benchmarks<br />
% of Funds from Local Sources: 63.8% National Percentile: 98%<br />
% of Funds from State: 8.1% National Percentile: 19%<br />
% of Funds from Tuition: 28.1% National Percentile: 28%<br />
The <strong>Maricopa</strong> <strong>Community</strong> <strong>College</strong>s are disproportionately funded from local property taxes compared to other community colleges in the<br />
United States. 97% receive a smaller percent of their revenue from local sources; 72% a larger percentage from tuition; and 81% a greater<br />
percent from state funds.<br />
Tuition: $76 National Percentile: 16%<br />
Tuition is for 2011-12. The national percentile indicates that 84% of community colleges have higher tuition charges than <strong>Maricopa</strong>.<br />
Cost Per Credit Hour: $101 National Percentile: 24%<br />
Source: National <strong>Community</strong> <strong>College</strong><br />
Benchmarking Project (NCCBP), 2011<br />
Cost Per Student FTE: $3,044 National Percentile: 24%<br />
This indicates that 76% of community colleges have higher costs than <strong>Maricopa</strong>.<br />
<strong>Chandler</strong>-<strong>Gilbert</strong> <strong>Community</strong> <strong>College</strong> <strong>Fast</strong> <strong>Facts</strong> 2011<br />
19
<strong>Community</strong><br />
Population<br />
POPULATION PROJECTION<br />
The Arizona Department of Administration<br />
Office of Employment and Population<br />
Statistics plans to release new projections<br />
by the end of <strong>2012</strong>. See: http://www.<br />
azstats.gov/<br />
QUEEN CREEK<br />
Includes the population in both <strong>Maricopa</strong><br />
and Pinal Counties<br />
CGCC CORE AREA<br />
<strong>Chandler</strong>, <strong>Gilbert</strong> and Queen Creek<br />
PERCENT CHANGE<br />
1990 to 2000 to<br />
1990 2000 2010 2010 2010<br />
MARICOPA COUNTY 2,122,101 3,072,149 3,817,117 79.9% 24.2%<br />
CHANDLER 90,533 176,581 236,123 160.8% 33.7%<br />
GILBERT 29,188 109,967 208,453 614.2% 89.6%<br />
MESA 288,091 396,375 439,041 52.4% 10.8%<br />
QUEEN CREEK 2,667 4,316 26,361 888.4% 510.8%<br />
TEMPE 141,865 158,625 161,719 14.0% 2.0%<br />
CORE AREA 122,388 290,864 470,937 284.8% 61.9%<br />
500,000 <br />
CENSUS<br />
450,000 <br />
400,000 <br />
350,000 <br />
300,000 <br />
250,000 <br />
200,000 <br />
150,000 <br />
100,000 <br />
50,000 <br />
0 <br />
1990 2000 2010 <br />
Source: US Census 1990, 2000 & 2010<br />
CHANDLER GILBERT QUEEN CREEK CORE AREA <br />
20 <strong>Chandler</strong>-<strong>Gilbert</strong> <strong>Community</strong> <strong>College</strong> <strong>Fast</strong> <strong>Facts</strong> 2011
East Valley<br />
Demographics<br />
Sources: US Census, 2010. See also: http://<br />
www.AZStats.gov<br />
US<br />
AZ<br />
<strong>Maricopa</strong><br />
COUNTY CHANDLER GILBERT MESA<br />
Queen<br />
Creek<br />
African AmericaN 12.2% 3.7% 4.6% 4.5% 3.2% 3.2% 3.2% 5.6%<br />
American indian 0.7% 4.0% 1.6% 1.1% 0.7% 1.9% 0.5% 2.4%<br />
asian 4.7% 2.7% 3.4% 8.1% 5.7% 1.9% 2.7% 5.6%<br />
native hawaiian 0.2% 0.2% 0.2% 0.2% 0.2% 0.3% 0.1% 0.4%<br />
hispanic 16.3% 29.6% 29.6% 21.9% 14.9% 26.4% 17.3% 21.1%<br />
white 63.7% 57.8% 58.7% 61.7% 72.9% 64.3% 74.0% 62.3%<br />
other race 0.2% 0.1% 0.1% 0.2% 0.1% 0.1% 0.1% 0.2%<br />
two or more races 1.9% 1.8% 1.9% 2.3% 2.4% 1.8% 2.1% 2.5%<br />
total 100.00% 100.00% 100.0% 100.00% 100.00% 100.0% 100.0% 100.0%<br />
TEMPE<br />
Note: Unemployment rates change<br />
monthly and are calculated by the US<br />
Bureau of Labor Statistics. The local<br />
area rates report the data down to the<br />
city level. See the BLS website for<br />
additional reports. Note that both the<br />
methodology and resulting rates may<br />
differ from report to report.<br />
EDUCATIONAL LEVEL<br />
HS+ BA+<br />
US 85% 28%<br />
AZ 85% 26%<br />
MARICOPA COUNTY 86% 29%<br />
CHANDLER 92% 38%<br />
GILBERT 96% 38%<br />
MESA 86% 24%<br />
QUEEN CREEK 97% 28%<br />
TEMPE 90% 41%<br />
Source: Educational Level: Percentages of Educational<br />
Attainment of Individuals 25 Years + from Selected Social<br />
Charateristics in the United States, 2008-2010 American<br />
<strong>Community</strong> Survey, 3-Year Estimates. American Fact<br />
Finder: US Census.<br />
Arizona Unemployment Rates<br />
January 2002 to January <strong>2012</strong><br />
UNEMPLOYED<br />
PERCENT NUMBER<br />
ARIZONA 8.5% 256,556<br />
MARICOPA COUNTY 7.3% 138,366<br />
PHOENIX-MESA-GLENDALE 7.5% 151,161<br />
CHANDLER 6.1% 8,061<br />
GILBERT 5.4% 6,175<br />
MESA 7.2% 15,913<br />
QUEEN CREEK 6.0% 783<br />
TEMPE 6.6% 6,487<br />
Source:<br />
Local Area Unemployment,<br />
U.S. Bureau of Labor Statistics.<br />
See: http://www.workforce.<br />
az.gov/pubs/labor/<br />
specrates<strong>2012</strong>.pdf<br />
Published as: Arizona<br />
Unemployment Statistics<br />
Program: Special<br />
Unemployment Report, July<br />
<strong>2012</strong>.<br />
Source: US Bureau of Labor Statistics.<br />
See: http://www.bls.gov/lau/ Under “Latest<br />
Numbers” go to Arizona.<br />
<strong>Chandler</strong>-<strong>Gilbert</strong> <strong>Community</strong> <strong>College</strong> <strong>Fast</strong> <strong>Facts</strong> 2011<br />
21
Completion agenda<br />
CHANDLER-‐GILBERT COMMUNITY COLLEGE<br />
COMPLETION AGENDA<br />
ACCESS, PERSISTENCE/RETENTION AND COMPLETION<br />
Sources: Except where noted, National<br />
<strong>Community</strong> <strong>College</strong> Benchmark Project<br />
(NCCBP), 2011<br />
* The 2011 NCCBP reports on data from the<br />
2009-10 Academic Year.<br />
*2040 Report; See District Institutional<br />
Effectiveness website<br />
**<strong>Maricopa</strong> Data Warehouse. Includes<br />
Short-Term & O/E Sections from Fall 2009<br />
*** ASSIST Data Warehouse<br />
ACCESS<br />
PATHWAYS<br />
COMPLETION<br />
Indicator Measure District NCCBP CGCC<br />
High School Graduated 2009-‐-‐Aended Sum I&II, Fall&Spr'09-‐10* 15,716 N/A 1,909<br />
Graduates Percent Prior Year High School Graduates Enrolled 25.0% 21.7% 32.9%<br />
Faculty Ave Credit SecSon Size 22.0 19.7 23.6<br />
RaSos Faculty/Student RaSo 16.6 18.3 20.2<br />
% Credit Hours Taught by Full-‐Time Faculty 39.6% 51.8% 41.9%<br />
% Credit Hours Taught by Part-‐Time Faculty 60.4% 48.2% 58.1%<br />
% SecSons Taught by Full-‐Time Faculty 36.6% 49.0% 39.6%<br />
% SecSons Taught by Part-‐Time Faculty 63.4% 51.0% 60.4%<br />
InstrucSonal Number of Online/Hybrid SecSons ** 3,974 N/A 170<br />
Delivery DL % of Credit Hours 17.8% 12.0% 6.5%<br />
Mode DL% of Total Credit SecSons 18.7% 11.6% 7.9%<br />
Successful Developmental Course Successful CompleSon (English) 64.6% 64.9% 64.6%<br />
Course Developmental Course Successful CompleSon (Math) 54.8% 56.9% 54.8%<br />
CompleSon <strong>College</strong> Level (100+) Successful Course CompleSon 74.0% 75.3% 77.1%<br />
Distance Learning Successful Course CompleSon 62.7% 66.2% 64.5%<br />
Student RetenSon Fall to Spring (Credit Students) 66.3% 71.8% 66.5%<br />
Persistence RetenSon Fall to Fall (Credit Students) 47.5% 49.5% 44.0%<br />
Credit Developmental Success, First <strong>College</strong> Level Math 68.6% 68.6% 71.1%<br />
Credit Developmental Success, First <strong>College</strong> Level English 73.9% 72.2% 76.7%<br />
Successful Number of Student Transfers<br />
Transfer to with 12+ <strong>Maricopa</strong> Hours in 2009-‐10 *** 27,929 N/A 3,249<br />
AZ Public Number of New Transfers<br />
UniversiSes with 12+ <strong>Maricopa</strong> Hours in 2009-‐10 *** 6,241 N/A 906<br />
Percent of First-‐Time, Full-‐Time, Degree/Cert Seeking<br />
Students who Transfer or Complete in 3 Yrs -‐-‐ IPEDS<br />
Fall 2007 GRS Cohort 21.3% 37.8% 23.1%<br />
Degree & 3 Year Completer Rate for First-‐Time, Full-‐Time Degree or<br />
Program CerSficate Seeking Students -‐-‐ IPEDS Fall 2007 GRS Cohort 14.9% 19.8% 12.7%<br />
Total Number of Degrees & CerSficates Awarded<br />
IPEDS 2009-‐10 17,784 N/A 1,185<br />
IPEDS 2010-‐11 21,396 N/A 1,522<br />
Number of People Receiving Degrees & CerSficates<br />
MCCCD, InsStuSonal EffecSveness Office, 2009-‐10 11,978 N/A 673<br />
MCCCD, InsStuSonal EffecSveness Office, 2010-‐11 14,289 N/A 889