Fast Facts 2012 - Chandler-Gilbert Community College - Maricopa ...
Fast Facts 2012 - Chandler-Gilbert Community College - Maricopa ...
Fast Facts 2012 - Chandler-Gilbert Community College - Maricopa ...

Create successful ePaper yourself
Turn your PDF publications into a flip-book with our unique Google optimized e-Paper software.
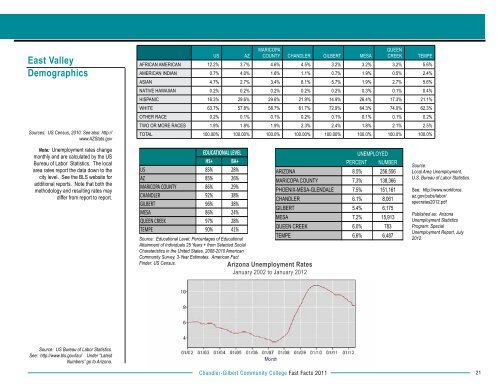
East Valley<br />
Demographics<br />
Sources: US Census, 2010. See also: http://<br />
www.AZStats.gov<br />
US<br />
AZ<br />
<strong>Maricopa</strong><br />
COUNTY CHANDLER GILBERT MESA<br />
Queen<br />
Creek<br />
African AmericaN 12.2% 3.7% 4.6% 4.5% 3.2% 3.2% 3.2% 5.6%<br />
American indian 0.7% 4.0% 1.6% 1.1% 0.7% 1.9% 0.5% 2.4%<br />
asian 4.7% 2.7% 3.4% 8.1% 5.7% 1.9% 2.7% 5.6%<br />
native hawaiian 0.2% 0.2% 0.2% 0.2% 0.2% 0.3% 0.1% 0.4%<br />
hispanic 16.3% 29.6% 29.6% 21.9% 14.9% 26.4% 17.3% 21.1%<br />
white 63.7% 57.8% 58.7% 61.7% 72.9% 64.3% 74.0% 62.3%<br />
other race 0.2% 0.1% 0.1% 0.2% 0.1% 0.1% 0.1% 0.2%<br />
two or more races 1.9% 1.8% 1.9% 2.3% 2.4% 1.8% 2.1% 2.5%<br />
total 100.00% 100.00% 100.0% 100.00% 100.00% 100.0% 100.0% 100.0%<br />
TEMPE<br />
Note: Unemployment rates change<br />
monthly and are calculated by the US<br />
Bureau of Labor Statistics. The local<br />
area rates report the data down to the<br />
city level. See the BLS website for<br />
additional reports. Note that both the<br />
methodology and resulting rates may<br />
differ from report to report.<br />
EDUCATIONAL LEVEL<br />
HS+ BA+<br />
US 85% 28%<br />
AZ 85% 26%<br />
MARICOPA COUNTY 86% 29%<br />
CHANDLER 92% 38%<br />
GILBERT 96% 38%<br />
MESA 86% 24%<br />
QUEEN CREEK 97% 28%<br />
TEMPE 90% 41%<br />
Source: Educational Level: Percentages of Educational<br />
Attainment of Individuals 25 Years + from Selected Social<br />
Charateristics in the United States, 2008-2010 American<br />
<strong>Community</strong> Survey, 3-Year Estimates. American Fact<br />
Finder: US Census.<br />
Arizona Unemployment Rates<br />
January 2002 to January <strong>2012</strong><br />
UNEMPLOYED<br />
PERCENT NUMBER<br />
ARIZONA 8.5% 256,556<br />
MARICOPA COUNTY 7.3% 138,366<br />
PHOENIX-MESA-GLENDALE 7.5% 151,161<br />
CHANDLER 6.1% 8,061<br />
GILBERT 5.4% 6,175<br />
MESA 7.2% 15,913<br />
QUEEN CREEK 6.0% 783<br />
TEMPE 6.6% 6,487<br />
Source:<br />
Local Area Unemployment,<br />
U.S. Bureau of Labor Statistics.<br />
See: http://www.workforce.<br />
az.gov/pubs/labor/<br />
specrates<strong>2012</strong>.pdf<br />
Published as: Arizona<br />
Unemployment Statistics<br />
Program: Special<br />
Unemployment Report, July<br />
<strong>2012</strong>.<br />
Source: US Bureau of Labor Statistics.<br />
See: http://www.bls.gov/lau/ Under “Latest<br />
Numbers” go to Arizona.<br />
<strong>Chandler</strong>-<strong>Gilbert</strong> <strong>Community</strong> <strong>College</strong> <strong>Fast</strong> <strong>Facts</strong> 2011<br />
21