DC conductivity and dielectric permittivity of collagenâchitosan films
DC conductivity and dielectric permittivity of collagenâchitosan films
DC conductivity and dielectric permittivity of collagenâchitosan films

You also want an ePaper? Increase the reach of your titles
YUMPU automatically turns print PDFs into web optimized ePapers that Google loves.
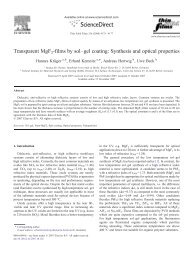
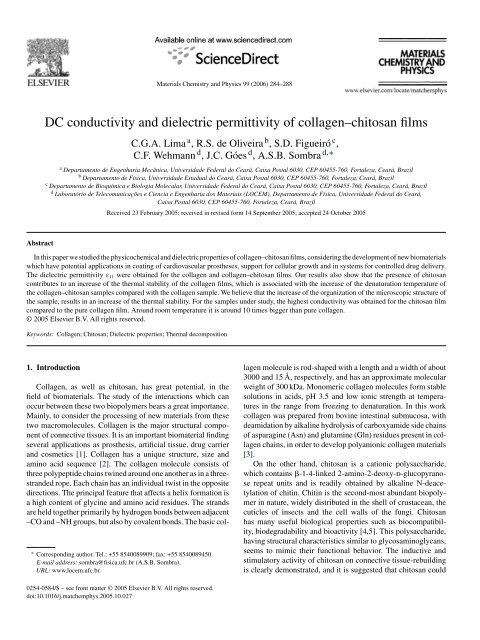
Materials Chemistry <strong>and</strong> Physics 99 (2006) 284–288<br />
<strong>DC</strong> <strong>conductivity</strong> <strong>and</strong> <strong>dielectric</strong> <strong>permittivity</strong> <strong>of</strong> collagen–chitosan <strong>films</strong><br />
C.G.A. Lima a , R.S. de Oliveira b , S.D. Figueiró c ,<br />
C.F. Wehmann d , J.C. Góes d , A.S.B. Sombra d,∗<br />
a Departamento de Engenharia Mecânica, Universidade Federal do Ceará, Caixa Postal 6030, CEP 60455-760, Fortaleza, Ceará, Brazil<br />
b Departamento de Física, Universidade Estadual do Ceará, Caixa Postal 6030, CEP 60455-760, Fortaleza, Ceará, Brazil<br />
c Departamento de Bioquímica e Biologia Molecular, Universidade Federal do Ceará, Caixa Postal 6030, CEP 60455-760, Fortaleza, Ceará, Brazil<br />
d Laboratório de Telecomunicações e Ciencia e Engenharia dos Materiais (LOCEM), Departamento de Física, Universidade Federal do Ceará,<br />
Caixa Postal 6030, CEP 60455-760, Fortaleza, Ceará, Brazil<br />
Received 23 February 2005; received in revised form 14 September 2005; accepted 24 October 2005<br />
Abstract<br />
In this paper we studied the physicochemical <strong>and</strong> <strong>dielectric</strong> properties <strong>of</strong> collagen–chitosan <strong>films</strong>, considering the development <strong>of</strong> new biomaterials<br />
which have potential applications in coating <strong>of</strong> cardiovascular prostheses, support for cellular growth <strong>and</strong> in systems for controlled drug delivery.<br />
The <strong>dielectric</strong> <strong>permittivity</strong> ε 11 were obtained for the collagen <strong>and</strong> collagen–chitosan <strong>films</strong>. Our results also show that the presence <strong>of</strong> chitosan<br />
contributes to an increase <strong>of</strong> the thermal stability <strong>of</strong> the collagen <strong>films</strong>, which is associated with the increase <strong>of</strong> the denaturation temperature <strong>of</strong><br />
the collagen–chitosan samples compared with the collagen sample. We believe that the increase <strong>of</strong> the organization <strong>of</strong> the microscopic structure <strong>of</strong><br />
the sample, results in an increase <strong>of</strong> the thermal stability. For the samples under study, the highest <strong>conductivity</strong> was obtained for the chitosan film<br />
compared to the pure collagen film. Around room temperature it is around 10 times bigger than pure collagen.<br />
© 2005 Elsevier B.V. All rights reserved.<br />
Keywords: Collagen; Chitosan; Dielectric properties; Thermal decomposition<br />
1. Introduction<br />
Collagen, as well as chitosan, has great potential, in the<br />
field <strong>of</strong> biomaterials. The study <strong>of</strong> the interactions which can<br />
occur between these two biopolymers bears a great importance.<br />
Mainly, to consider the processing <strong>of</strong> new materials from these<br />
two macromolecules. Collagen is the major structural component<br />
<strong>of</strong> connective tissues. It is an important biomaterial finding<br />
several applications as prosthesis, artificial tissue, drug carrier<br />
<strong>and</strong> cosmetics [1]. Collagen has a unique structure, size <strong>and</strong><br />
amino acid sequence [2]. The collagen molecule consists <strong>of</strong><br />
three polypeptide chains twined around one another as in a threestr<strong>and</strong>ed<br />
rope. Each chain has an individual twist in the opposite<br />
directions. The principal feature that affects a helix formation is<br />
a high content <strong>of</strong> glycine <strong>and</strong> amino acid residues. The str<strong>and</strong>s<br />
are held together primarily by hydrogen bonds between adjacent<br />
–CO <strong>and</strong> –NH groups, but also by covalent bonds. The basic col-<br />
∗ Corresponding author. Tel.: +55 8540089909; fax: +55 8540089450.<br />
E-mail address: sombra@fisica.ufc.br (A.S.B. Sombra).<br />
URL: www.locem.ufc.br.<br />
lagen molecule is rod-shaped with a length <strong>and</strong> a width <strong>of</strong> about<br />
3000 <strong>and</strong> 15 Å, respectively, <strong>and</strong> has an approximate molecular<br />
weight <strong>of</strong> 300 kDa. Monomeric collagen molecules form stable<br />
solutions in acids, pH 3.5 <strong>and</strong> low ionic strength at temperatures<br />
in the range from freezing to denaturation. In this work<br />
collagen was prepared from bovine intestinal submucosa, with<br />
deamidation by alkaline hydrolysis <strong>of</strong> carboxyamide side chains<br />
<strong>of</strong> asparagine (Asn) <strong>and</strong> glutamine (Gln) residues present in collagen<br />
chains, in order to develop polyanionic collagen materials<br />
[3].<br />
On the other h<strong>and</strong>, chitosan is a cationic polysaccharide,<br />
which contains -1-4-linked 2-amino-2-deoxy-d-glucopyranose<br />
repeat units <strong>and</strong> is readily obtained by alkaline N-deacetylation<br />
<strong>of</strong> chitin. Chitin is the second-most abundant biopolymer<br />
in nature, widely distributed in the shell <strong>of</strong> crustacean, the<br />
cuticles <strong>of</strong> insects <strong>and</strong> the cell walls <strong>of</strong> the fungi. Chitosan<br />
has many useful biological properties such as biocompatibility,<br />
biodegradability <strong>and</strong> bioactivity [4,5]. This polysaccharide,<br />
having structural characteristics similar to glycosaminoglycans,<br />
seems to mimic their functional behavior. The inductive <strong>and</strong><br />
stimulatory activity <strong>of</strong> chitosan on connective tissue-rebuilding<br />
is clearly demonstrated, <strong>and</strong> it is suggested that chitosan could<br />
0254-0584/$ – see front matter © 2005 Elsevier B.V. All rights reserved.<br />
doi:10.1016/j.matchemphys.2005.10.027
C.G.A. Lima et al. / Materials Chemistry <strong>and</strong> Physics 99 (2006) 284–288 285<br />
be considered a primer on which a normal tissue architecture is<br />
organized.<br />
Polymeric composite materials, both <strong>of</strong> natural <strong>and</strong> synthetic<br />
origin, constitute by far the broadest <strong>and</strong> most diverse class <strong>of</strong><br />
biomaterials. Charge <strong>and</strong> polarization storage via the electret<br />
state has been found in many biomaterials. As biomaterials,<br />
electrets have found interesting applications as antithrombogenic<br />
surfaces, stimulation <strong>of</strong> tissue growth in bone <strong>and</strong> special<br />
artificial membranes [6,7]. Fundamental macromolecules<br />
<strong>of</strong> biology, such as collagen <strong>and</strong> chitin, exhibit the effect.<br />
Studies on the collagen <strong>and</strong> chitosan interactions showed that<br />
two kinds <strong>of</strong> interactions can give rise between the two polymers<br />
when they are in contact with water: an electrostatic<br />
complex <strong>and</strong> a hydrogen bonding type complex, in the presence<br />
<strong>of</strong> a great excess <strong>of</strong> chitosan [8]. The objective <strong>of</strong> this<br />
research is the study <strong>of</strong> physicochemical, <strong>dielectric</strong> <strong>and</strong> electrical<br />
properties <strong>of</strong> collagen–chitosan <strong>films</strong>, considering the development<br />
<strong>of</strong> new biomaterials, since that piezoelectric polymer<br />
<strong>films</strong> have been tested as implants to stimulate bone growth<br />
[9].<br />
2. Experimental methods<br />
2.1. Materials<br />
The soluble anionic collagen was prepared by alkaline treatment <strong>of</strong> bovine<br />
intestinal submucosa, at 20 ◦ C from period <strong>of</strong> 72 h [10], followed by homogenization<br />
in 0.5 mol L −1 acetic acid solution <strong>and</strong> brought to a final collagen<br />
concentration <strong>of</strong> 10 g L −1 . The fully deacetylated chitosan was purchased from<br />
SIGMA <strong>and</strong> was solubilized in 0.5 mol L −1 acetic acid solution to obtain a concentration<br />
<strong>of</strong> 10 g L −1 .<br />
2.2. Preparation <strong>of</strong> the <strong>films</strong><br />
The membranes, casted in acrylic molds, from a collagen solution containing<br />
chitosan in various proportions ranging from 0 to 100%. The collagen–chitosan<br />
membranes were prepared with 0, 10, 50, 90 <strong>and</strong> 100% <strong>of</strong> collagen (w/w) (Samples<br />
CH100, CH90CO10, CH50CO50, CH10CO90, CO100, respectively).<br />
2.3. Differential scanning calorimetry<br />
Table 1<br />
Density (ρ), thickness (e), <strong>dielectric</strong> <strong>permittivity</strong> (ε), <strong>dielectric</strong> loss (diameter<br />
for all samples: 1 cm)<br />
Samples ρ (Kg m −3 ) e (m) 1 MHz (ε/ε 0 ) 1 GHz (ε/ε 0 )<br />
CH100 1078.45 40.8 3.94 2.71<br />
CH90CO10 1192.4 68 3.35 2.29<br />
CH50CO50 977.71 83.4 2.68 2.05<br />
CH10CO90 936.53 86.4 2.96 2.41<br />
CO100 670.76 55.9 2.60 2,3<br />
2.6. <strong>DC</strong> <strong>conductivity</strong><br />
Samples used for electrical measurements were plates in the circular geometry,<br />
using silver electrodes, with the same surface area (1 cm <strong>of</strong> diameter <strong>and</strong><br />
thickness ranging from 40 to 86 m, see (Table 1)). The <strong>DC</strong> electrical <strong>conductivity</strong><br />
was obtained by measuring the resistance <strong>of</strong> the samples with an electrometer<br />
type 617 programmable electrometer (Keithly 617 Programmable Electrometer),<br />
using the constant <strong>DC</strong> voltage (50 V) <strong>and</strong> measuring V/I when the sample<br />
is heated from low to high temperature (6 K min −1 ). Where V is the voltage<br />
applied to the sample <strong>and</strong> I is the measured current intensity. The relative error<br />
<strong>of</strong> the electrical <strong>conductivity</strong> was less than ±5%.<br />
3. Results <strong>and</strong> discussion<br />
The IR spectra <strong>of</strong> the collagen, chitosan <strong>and</strong> collagen–<br />
chitosan blend <strong>films</strong> are shown in Fig. 1, for samples CH100,<br />
CH50CO50 <strong>and</strong> CO100, respectively. The primary b<strong>and</strong>s <strong>of</strong><br />
CO100 arise from the peptide bond vibrations: amides I, II <strong>and</strong><br />
III, centered at 1660, 1550, <strong>and</strong> 1238 cm −1 , respectively [11,12].<br />
The major feature <strong>of</strong> the IR spectrum <strong>of</strong> collagen film is the<br />
Amide I b<strong>and</strong> between 1640 <strong>and</strong> 1660 cm −1 , which arises from<br />
the stretching vibration <strong>of</strong> C O groups <strong>of</strong> amide groups in protein.<br />
The intense absorption between 1500 <strong>and</strong> 1600 cm −1 is<br />
due to the Amide II mode, observed at 1550 cm −1 in the spectrum<br />
for collagen, which arises from N H stretching vibration<br />
strongly coupled to the C N stretching vibration <strong>of</strong> collagen<br />
amide groups. Signals in the spectral region <strong>of</strong> 1200–1400 cm −1<br />
absorption are generally attributed to the Amide III, arising due<br />
to the C N stretching <strong>and</strong> N H in plane bending from amide<br />
linkages. The C N stretching vibration <strong>of</strong> the cyclic proline<br />
This was carried out using a Shimadzu DSC-50 equipment. Accurately<br />
weighed (5–8 mg) dry material was placed in an aluminium cup <strong>and</strong> hermatically<br />
sealed. Empty cup was used as reference. Samples were analyzed under<br />
continuous flow <strong>of</strong> dry nitrogen gas at a heating rate <strong>of</strong> 5 ◦ C min −1 from 0 to<br />
200 ◦ C.<br />
2.4. X-ray diffraction<br />
The X-ray diffraction (XRD) patterns were obtained at room temperature<br />
(300 K) by step scanning using powdered samples. We used 5 s for each step<br />
<strong>of</strong> counting time, with a Cu K tube at 40 kV <strong>and</strong> 25 mA using the geometry <strong>of</strong><br />
Bragg-Brentano.<br />
2.5. Dielectric function measurements<br />
The complex <strong>dielectric</strong> function measurements were obtained from a HP<br />
4291A Material Impedance Analyzer in conjunction with to HP 4194 Impedance<br />
Analyzer, which jointly cover the region <strong>of</strong> 100 Hz to 1.8 GHz.<br />
Fig. 1. Infrared spectra <strong>of</strong> the samples CH100, CH50CO50 <strong>and</strong> CO100.
286 C.G.A. Lima et al. / Materials Chemistry <strong>and</strong> Physics 99 (2006) 284–288<br />
may also contribute absorption at 1452 cm −1 . In addition, significant<br />
absorption due to CH 2 wagging vibrations from the<br />
glycine backbone <strong>and</strong> proline side chains are also seen in the<br />
region between 1200 <strong>and</strong> 1400 cm −1 . The absorption seen at<br />
1340 cm −1 is attributed to CH 2 wagging vibration <strong>of</strong> the proline<br />
side chain.<br />
Strong absorption b<strong>and</strong>s have been detected in CH100 film<br />
spectra, namely: the complex b<strong>and</strong> in the range 1690–1300 cm −1<br />
corresponding to absorption <strong>of</strong> carbonyl <strong>and</strong> amide groups<br />
(Amide I b<strong>and</strong> at 1665 cm −1 <strong>and</strong> Amide II b<strong>and</strong> at 1565 cm −1 )<br />
<strong>and</strong> the strong absorption b<strong>and</strong> between 800 <strong>and</strong> 1200 cm −1 ,<br />
which is characteristic <strong>of</strong> pyranose rings <strong>of</strong> chitosan [13,14].<br />
Moreover, these spectra can be influenced by parameters such as<br />
the deacetylation percentage or crystallinity. Chitosan is essentially<br />
produced from chitin by a deacetylation reaction. The IR<br />
spectra <strong>of</strong> chitosan correspond to a convolution <strong>of</strong> specific signals<br />
specific to both carbohydrates <strong>and</strong> absorption due to amine<br />
<strong>and</strong> amide functions. A shoulder is first observed at 1637 cm −1 ,<br />
which corresponds to the overlap <strong>of</strong> an Amide I b<strong>and</strong> due to<br />
the residual acetylated residues <strong>and</strong> –OH b<strong>and</strong>s corresponding<br />
to the pyranose structure. A transition corresponding to the<br />
Amide II b<strong>and</strong> can be detected by the presence <strong>of</strong> a strong b<strong>and</strong><br />
at 1560 cm −1 . In the IR spectra <strong>of</strong> the CH50CO50, one can<br />
observed a decrease <strong>of</strong> the b<strong>and</strong> around 1657 cm −1 observed<br />
in the pure chitosan, which can be attributed to local modifications<br />
leading to small variations <strong>of</strong> the rotation <strong>and</strong> vibration<br />
frequencies.<br />
The DSC technique has been used by different authors to<br />
elucidate the native structure <strong>of</strong> collagen, <strong>and</strong> how the molecule<br />
associates to a cross-link agent or other macromolecules [15].<br />
Denaturation is defined as a transition from the triple helix to<br />
a r<strong>and</strong>omly coiled form, taking place in the domains between<br />
the cross-links. The bonds which stabilize the superhelix are<br />
hydrogen, hydrophobic, Van der Waal’s bonds <strong>and</strong> interactions<br />
between oppositely charged residues on side chains. The nonr<strong>and</strong>om<br />
distribution <strong>of</strong> ions <strong>and</strong> hydrophobic side chains along<br />
the repeating unit results in the occurrence <strong>of</strong> charged, positive<br />
<strong>and</strong> negative, <strong>and</strong> hydrophobic patches that contribute to stabilization<br />
<strong>of</strong> the structures through electrostatic <strong>and</strong> hydrophobic<br />
interactions. On the other h<strong>and</strong>, hydrogen bonded water plays<br />
a big part in the stabilization <strong>of</strong> the molecule. All these noncovalent<br />
bondings break down on heating. The breakdown starting<br />
at the weakest points <strong>of</strong> the helix, between the stabilizing<br />
clusters. A small region containing a few linkages <strong>of</strong> low energy<br />
will act as a favorable site to initiate denaturation [16].<br />
The DSC <strong>of</strong> chitosan (CH100), collagen (CO100) <strong>and</strong> the<br />
blends <strong>films</strong> are shown in Fig. 2. The results <strong>of</strong> the thermogram<br />
analysis indicate that heating temperature influences the membranes<br />
structure significantly. Both samples show an endothermic<br />
transition with denaturation temperatures <strong>of</strong> 60.75 ◦ C for<br />
CH100 <strong>and</strong> 73.75 ◦ C for CO100, (see Table 2). This is an indication<br />
that the denaturation energy <strong>of</strong> collagen film was higher<br />
than chitosan film. One can see the DSC spectra for samples<br />
CH90CO10, CH50CO50, CH10CO90 which show denaturation<br />
temperatures <strong>of</strong> 50.31, 75.59 <strong>and</strong> 58.73 ◦ C, respectively. Close<br />
examination <strong>of</strong> thermograms in Fig. 2 reveals that there are differences<br />
in the endotherm peak area, showing that CH50CO50<br />
Fig. 2. DSC curves <strong>of</strong> the samples CH100, CO100 CH90CO10, CH50CO50<br />
<strong>and</strong> CH10CO90.<br />
Table 2<br />
E <strong>DC</strong> activation energy from the TSPC, σ <strong>DC</strong> is the <strong>DC</strong> <strong>conductivity</strong> at room<br />
temperature (300 K)<br />
Samples E <strong>DC</strong> (eV) σ <strong>DC</strong> (m) −1 (300 K) a T D ( ◦ C) b<br />
CH100 0.31 3.4 × 10 −17 60.75<br />
CH90CO10 0.39 1.3 × 10 −17 50.31<br />
CH50CO50 0.38 9.2 × 10 −18 75.59<br />
CH10CO90 0.77 5.2 × 10 −18 58.73<br />
CO100 0.50 2.4 × 10 −19 73.75<br />
Denaturation temperature from the DSC measurements (T D ).<br />
a The relative error <strong>of</strong> the electrical <strong>conductivity</strong> was less than ±5%.<br />
b The relative error <strong>of</strong> the DSC was less than ±1%.<br />
film has the higher denaturation energy. These results suggest<br />
that collagen <strong>and</strong> chitosan may interact, in this concentrations,<br />
to form more stable <strong>films</strong>, which may be due to formation <strong>of</strong><br />
a polyanion–polycation complex between the anionic collagen<br />
<strong>and</strong> chitosan [8] that improve the water uptake in the blend<br />
matrix [17].<br />
The X-ray diffraction analyses are shown in Fig. 3. Ascan<br />
be seen from the data, the collagen membrane (CO100) shows<br />
one reflection around 7.9 ◦ <strong>and</strong> a very broad b<strong>and</strong> around 21 ◦<br />
Fig. 3. X-ray diffraction analysis <strong>of</strong> the sample CH100, CH90CO10,<br />
CH50CO50, CH10CO90 <strong>and</strong> CO100.
C.G.A. Lima et al. / Materials Chemistry <strong>and</strong> Physics 99 (2006) 284–288 287<br />
varies from 0.38 to 0.77 eV. For the samples under study, the<br />
highest <strong>conductivity</strong> was obtained for CH100. Around room<br />
temperature it is around ten times bigger than pure collagen<br />
(CO100). We believe that the polycationic characteristic <strong>of</strong> the<br />
chitosan molecule is the responsible for the higher electric <strong>conductivity</strong><br />
compared to the collagen. For the collagen film one<br />
has a mixing <strong>of</strong> positive <strong>and</strong> negative charges which lead to a<br />
decrease <strong>of</strong> the <strong>conductivity</strong>. With the addition <strong>of</strong> chitosan in the<br />
blends film, the cations are the dominant charges, <strong>and</strong> may be<br />
responsible to the increase <strong>of</strong> the <strong>DC</strong> <strong>conductivity</strong>.<br />
4. Conclusions<br />
Fig. 4. <strong>DC</strong> <strong>conductivity</strong> <strong>of</strong> samples CH100, CH90CO10, CH50CO50,<br />
CH10CO90 <strong>and</strong> CO100 as a function <strong>of</strong> temperature.<br />
which is quite characteristic <strong>of</strong> an amorphous phase. If one start<br />
the increase <strong>of</strong> the chitosan concentration the peak at 7.9 ◦ start<br />
decreasing <strong>and</strong> new peaks are present in the diffraction pattern.<br />
In the case <strong>of</strong> the chitosan membrane (CH100), two peaks were<br />
observed. One is at 11.5 ◦ <strong>and</strong> the other at 18.2 ◦ . These two<br />
peaks are related to two different types <strong>of</strong> crystals: crystal (1)<br />
<strong>and</strong> crystal (2) [18]. The first peak at 11.5 ◦ is related to crystal<br />
(1) having unit cell <strong>of</strong> a = 7.76, b = 10.91, c = 10.30 (Å), β =90 ◦ .<br />
The unit cell size <strong>of</strong> crystal (1) is larger than that <strong>of</strong> crystal (2).<br />
The unit cell <strong>of</strong> crystal (1) consists <strong>of</strong> two monomer units along<br />
the main chain axis. The peak at 18.2 ◦ is related to crystal (2) in<br />
the chitosan membrane. The unit cell <strong>of</strong> crystal (2) is <strong>of</strong> a = 4.4,<br />
b = 10.0, c = 10.30 (Å), <strong>and</strong> β =90 ◦ [18].<br />
In Table 1 one has the <strong>dielectric</strong> constant (ε) at 1 MHz <strong>and</strong><br />
1 GHz for all the samples. Table 1 also show that chitosan has<br />
the highest value <strong>of</strong> the <strong>dielectric</strong> constant for the frequencies<br />
under study. The chitosan film (CH100) shows the highest value<br />
for the <strong>dielectric</strong> <strong>permittivity</strong>, 3.94 at 1 MHz, while collagen<br />
film (CO100) presents the lowest density, 670.76 kg m −2 , <strong>and</strong><br />
<strong>dielectric</strong> <strong>permittivity</strong>, 2, 6 at 1 MHz.<br />
On the basis <strong>of</strong> electrical <strong>conductivity</strong> studies, the activation<br />
energy E A <strong>of</strong> the charge conduction process for collagen,<br />
chitosan <strong>and</strong> blends <strong>films</strong> can be determined according to the<br />
following Arrhenius formula:<br />
( )<br />
EA<br />
σ(T ) = σ 0 exp<br />
(1)<br />
kT<br />
where st<strong>and</strong>s for electrical <strong>conductivity</strong>, T, the temperature, <strong>and</strong><br />
k is the Boltzmann’s constant. Calculations were performed in<br />
the intervals <strong>of</strong> linearity <strong>of</strong> the following relationship:<br />
( )<br />
EA<br />
log σ = log σ 0 +<br />
(2)<br />
kT<br />
The Arrehenius plot <strong>of</strong> the electrical <strong>conductivity</strong> <strong>and</strong> the temperature<br />
is shown in Fig. 4.InTable 2 we have the <strong>DC</strong> <strong>conductivity</strong><br />
at room temperature <strong>and</strong> the activation energy <strong>of</strong> all samples.<br />
At room temperature (T = 300 K) the <strong>conductivity</strong> increases from<br />
2.4 × 10 −19 to 3.4 × 10 −17 (m) −1 . The activation energy also<br />
We did a study <strong>of</strong> the physicochemical <strong>and</strong> <strong>dielectric</strong> properties<br />
<strong>of</strong> collagen–chitosan <strong>films</strong>.<br />
The IR spectra <strong>of</strong> the collagen, chitosan <strong>and</strong> collagen–<br />
chitosan blend <strong>films</strong> are compatible with the main results<br />
reported in the literature. The DSC <strong>of</strong> chitosan <strong>and</strong> collagen indicate<br />
that heating temperature influences the membranes structure<br />
significantly. Both samples show an endothermic transition with<br />
denaturation temperatures <strong>of</strong> 60.75 <strong>and</strong> 73.75 ◦ C, respectively.<br />
This is an indication that the denaturation energy <strong>of</strong> collagen film<br />
was higher than chitosan film. For the blends, it was observed<br />
that the collagen <strong>and</strong> chitosan may interact to form more stable<br />
<strong>films</strong>, which may be due to formation <strong>of</strong> a polyanion–polycation<br />
complex between the anionic collagen <strong>and</strong> chitosan that improve<br />
the water uptake in the blend matrix. The chitosan film presents<br />
the highest value <strong>of</strong> the <strong>dielectric</strong> constant for the frequencies<br />
under study. At room temperature (T = 300 K) the <strong>conductivity</strong><br />
increases from 2.4 × 10 −19 to 3.4 × 10 −17 (m) −1 . The activation<br />
energy also varies from 0.38 to 0.77 eV. For the samples under<br />
study, the highest <strong>conductivity</strong> was obtained for CH100. Around<br />
room temperature it is around ten times bigger than pure collagen<br />
(CO100). We believe that the polycationic characteristic <strong>of</strong><br />
the chitosan molecule is the responsible for the higher electric<br />
<strong>conductivity</strong> compared to the collagen. For the collagen film one<br />
has a mixing <strong>of</strong> positive <strong>and</strong> negative charges which lead to a<br />
decrease <strong>of</strong> the <strong>conductivity</strong>. With the addition <strong>of</strong> chitosan in the<br />
collagen film, the cations are the dominant charges, responsible<br />
to the increase <strong>of</strong> the <strong>DC</strong> <strong>conductivity</strong>.<br />
Acknowledgements<br />
This work was partly sponsored by FINEP, FUNCAP, CNPq,<br />
CAPES (Brazilian agencies).<br />
References<br />
[1] C.H. Lee, A. Singla, Y. Lee, Biomedical applications <strong>of</strong> collagen, Int. J.<br />
Pharm. 221 (1–2) (2001) 1–22.<br />
[2] M.E. Nimni, R.D. Harkness, Molecular structures <strong>and</strong> functions <strong>of</strong> collagen,<br />
in: M.E. Nimni (Ed.), Collagen-Biochemistry I, CRC Press, Boca<br />
Raton, FL, 1988, pp. 1–79.<br />
[3] M.R. Bet, G. Goissis, C.A. Lacerda, Characterization <strong>of</strong> polyanionic collagen<br />
prepared by selective hydrolysis <strong>of</strong> asparagine <strong>and</strong> glutamine carboxyamide<br />
side chains, Biomacromolecules 2 (4) (2001) 1074–1079.<br />
[4] S. Hirano, Chitin <strong>and</strong> chitosan as novel biotechnological materials, Polym.<br />
Int. 48 (1999) 732–734.
288 C.G.A. Lima et al. / Materials Chemistry <strong>and</strong> Physics 99 (2006) 284–288<br />
[5] R.A.A. Muzzarelli, V. Baldassrre, F. Conti, P. Ferrara, G. Biagini, Biological<br />
activity <strong>of</strong> chitosan: ultrastructural study, Biomaterials 9 (1988)<br />
247–252.<br />
[6] S. Mascarenhas, Bioelectrets, in: Topics in Applied Physics, Electrets, 23,<br />
Springer-Verlag, Berlin, 1987.<br />
[7] E. Fukada, in: H.S. Nalwa (Ed.), Piezoelectricity <strong>and</strong> Pyroelectricity <strong>of</strong><br />
Biopolymers. Ferroelectric Polymers, Marcel Dekker Inc., New York,<br />
1995, pp. 393–439.<br />
[8] M.N. Taravel, A. Doamrd, Collagen <strong>and</strong> its interaction with chitosan. Part<br />
II. Influence <strong>of</strong> the physicochemical characteristics <strong>of</strong> collagen, Biomaterials<br />
16 (11) (1995) 865–871.<br />
[9] E. Fukada, Piezoelectric <strong>of</strong> bone <strong>and</strong> osteogenesis by piezoelectric <strong>films</strong>,<br />
in: R.O. Becker (Ed.), Mechanisms <strong>of</strong> Growth Control, Charles C Thomas,<br />
Springfield, IL, 1981, p. 192.<br />
[10] G. Goissis, A.M.G. Plepis, J.L. Rocha, A process for the extraction <strong>of</strong><br />
collagen from tissues with aqueous organic solvent in alkaline media, 1994<br />
(BR PI 9.405.043-0).<br />
[11] B. Madhan, C. Muralidharan, R. Jayakumar, Study on the stabilisation <strong>of</strong><br />
collagen with vegetable tannins in the presence <strong>of</strong> acrylic polymer, Biomaterials<br />
23 (14) (2002) 2841–2847.<br />
[12] Y. Tsuboi, N. Kimoto, M. Kabeshita, A. Itaya, Pulsed laser deposition <strong>of</strong><br />
collagen <strong>and</strong> keratin, J. Photochem. Photobiol. A: Chem. 145 (3) (2001)<br />
209–214.<br />
[13] J. Brugnerotto, J. Lizardi, F.M. Goycoolea, W. Argüelles-Monal, J. Desbrières,<br />
M. Rinaudo, An infrared investigation in relation with chitin <strong>and</strong><br />
chitosan characterization, Polymer 42 (8) (2001) 3569–3580.<br />
[14] K.V. Harish Prashanth, F.S. Kittur, R.N. Tharanathan, Solid state structure<br />
<strong>of</strong> chitosan prepared under different N-deacetylating conditions, Carbohydrate<br />
Polym. 50 (1) (2002) 27–33.<br />
[15] P.L. Privalov, E.I. Tiktopoulo, Thermal conformational transformation <strong>of</strong><br />
tropocollagen. Part I. Calorimetric study, Biopolymers 9 (1970) 127–<br />
130.<br />
[16] C. Chahine, Changes in hydrothermal stability <strong>of</strong> leather <strong>and</strong> parchment<br />
with deterioration: a DSC study, Thermochim. Acta 365 (1–2) (2000)<br />
101–110.<br />
[17] A.A. Salomé Machado, V.C.A. Martins, A.M.G. Plepis, Thermal <strong>and</strong> rheological<br />
behavior <strong>of</strong> collagen chitosan blends, J. Therm. Anal. Calorim. 67<br />
(2002) 491–498.<br />
[18] R.J. Samuels, Solid state characterization <strong>of</strong> the structure <strong>of</strong> chitosan <strong>films</strong>,<br />
J. Polym. Sci., Polym. Phys. 19 (1981) 1081.