Positive Energy: how renewable electricity can transform ... - WWF UK
Positive Energy: how renewable electricity can transform ... - WWF UK
Positive Energy: how renewable electricity can transform ... - WWF UK

Create successful ePaper yourself
Turn your PDF publications into a flip-book with our unique Google optimized e-Paper software.
The stretch scenarios<br />
In addition to the four scenarios set out above, GL GH modelled two stretch (C) scenarios,<br />
one for each level of demand. In these, interconnection is equal to that assumed in the<br />
high interconnection B scenarios. However, in contrast to B1 and B2, in the stretch<br />
scenarios, it is assumed that there is an export market for surplus <strong>electricity</strong> generated<br />
at times of high <strong>renewable</strong> energy production. In the stretch scenarios GL GH therefore<br />
assumes that it is economic to build <strong>renewable</strong>s in excess of domestic demand or up<br />
to maximum <strong>UK</strong> <strong>electricity</strong> demand plus total interconnector capacity. This means it’s<br />
feasible to build more <strong>renewable</strong>s than GL GH assumes in the four main scenarios. The<br />
viability of the stretch scenarios rests on the assumption that increased interconnection<br />
with European grids would provide an export market for the <strong>UK</strong>’s surplus <strong>renewable</strong><br />
generation, as well as helping secure the <strong>UK</strong> <strong>electricity</strong> system at times of high demand.<br />
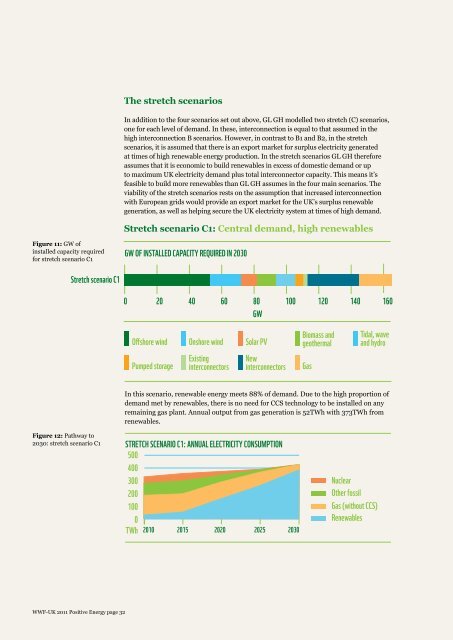
Stretch scenario C1: Central demand, high <strong>renewable</strong>s<br />
Figure 11: GW of<br />
installed capacity required<br />
for stretch scenario C1<br />
GW OF INSTALLED CAPACITY REQUIRED IN 2030<br />
Stretch scenario C1<br />
0 20 40 60 80 100 120 140 160<br />
GW<br />
Offshore wind<br />
Onshore wind<br />
Solar PV<br />
Biomass and<br />
geothermal<br />
Tidal, wave<br />
and hydro<br />
Pumped storage<br />
Existing<br />
interconnectors<br />
New<br />
interconnectors<br />
Gas<br />
In this scenario, <strong>renewable</strong> energy meets 88% of demand. Due to the high proportion of<br />
demand met by <strong>renewable</strong>s, there is no need for CCS technology to be installed on any<br />
remaining gas plant. Annual output from gas generation is 52TWh with 373TWh from<br />
<strong>renewable</strong>s.<br />
Figure 12: Pathway to<br />
2030: stretch scenario C1<br />
STRETCH SCENARIO C1: ANNUAL ELECTRICITY CONSUMPTION<br />
500<br />
400<br />
300<br />
200<br />
100<br />
0<br />
TWh 2010 2015 2020 2025 2030<br />
Nuclear<br />
Other fossil<br />
Gas (without CCS)<br />
Renewables<br />
<strong>WWF</strong>-<strong>UK</strong> 2011 <strong>Positive</strong> <strong>Energy</strong> page 32